Biomedical Engineering Reference
In-Depth Information
0
265
530
Retardation
Re
[nm]
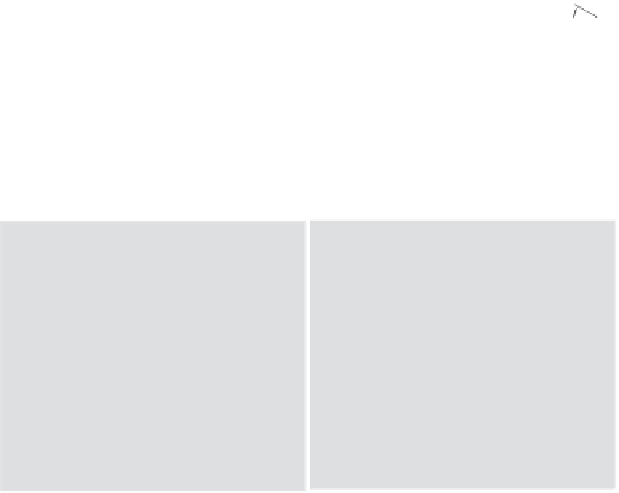
Figure 4.18
Color map calculated from equation 4.36 for RGB for
retardations within the model below 530
nm and stress
°
direction below 180
.
[kPa]
[deg]
250
180
θ
200
135
150
90
100
50
45
a)
b)
0
0
Figure 4.19
Simultaneous measurements of stress magnitude (a) and
direction (b) for the single-layer model shown in Fig. 4.17.
P=120mmHg
P=160mmHg
[µ
m]
P=80mmHg
P=80mmHg+Guid wire
[µ
m]
4000
4000
3000
3000
2000
2000
1000
1000
A
160
400
400
A
120
A
80
400
A
80GW
400
0
0
[
nm]
[
nm]
250
250
167
167
125
125
62
62
R
160
400
400
R
80
400
R
400
80GW
R
120
a)
b)
0
0
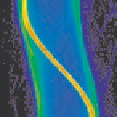
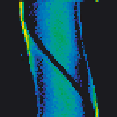
Figure 4.21
(a) Sinograms of optical path length and retardation with
80
mmHg of pressure inside the model and with guide wire
inserted. (b) Sinograms of optical path length and retardation
with pressures of 120
mmHg and 160
mmHg.


Search WWH ::

Custom Search