Biomedical Engineering Reference
In-Depth Information
6.5.3
Stress Analysis in the Bleb Model Using Blood
Pressure Simulation
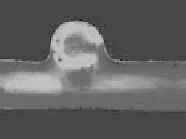
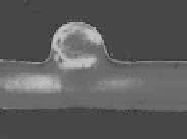
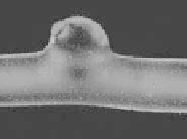
Photoelastic stress analysis was used for studying the stress in the
multilayer model of saccular aneurysm with bleb while a pulsed low
was circulated through it. The low waveform had a sine shape with
a frequency of 1 Hz, a pressure range of 85-115 mmHg and low
rate of 250 mL/min. For an inner pressure of 85 mmHg, the number
of pixels with stress above 960 mmHg is 0.2%. When pressure rose
to 115 mmHg, that percentage increased to 7.1%. As consequence
of plastic deformation and pressure change the bleb size increased
while its membrane became thinner. The bleb membrane thickness
reduction inally produced a rupture of the phantom, producing
inner pressure loss and a reduction from 7.2% to 0.2% in percentage
of pixels within the high stress range (Fig. 6.19) [16].
;
mmHg]
Saccular
Aneurysm
Stress Local Maximum
Bleb
1920
1440
Phantom Lumen
5.0mm
P
min
=85mmHg
a)
P
max
=115mmHg
960
Stress Local Maximum
Bleb
Saccular
Aneurysm
480
>200mmHg
c)
b)
Before Rupture
After Rupture
0
Figure 6.19
(a) Phantom of saccular aneurysm with bleb. (b) Source
image example for stress measurement, green light intensity
represents the stress in the phantom wall. Bleb shape is
appreciated over 200 mmHg. (c) Stress analysis in Aneurysm
Bleb phantom with pulsed low circulation at: minimum
pressure, maximum pressure, before rupture and after rupture.
Red arrows point a measurement distortion appearing when
the angle between the light beam and
T
3
increases. See also
Color Insert.
6.6
Portable Simulator for Blood Pressure
A low with temperature around 37°C and pressure variation around
human normal ranges is desirable because endovascular tools


Search WWH ::

Custom Search