Biomedical Engineering Reference
In-Depth Information
6.5.2
Stress Analysis in the Bleb Model Using Static
Pressure
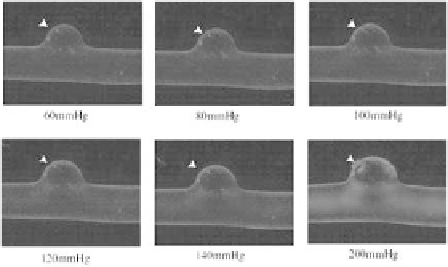
The multilayer model of the saccular aneurysm with bleb was
connected to closed loop pipe circuit illed with a glycerin solution at
60%. The pressure inside the circuit was increased from 60 mmHg
to 200 mmHg. The deformation of the model with inner pressure is
observed in Fig. 6.17. As we can see, the bleb shape appears at the
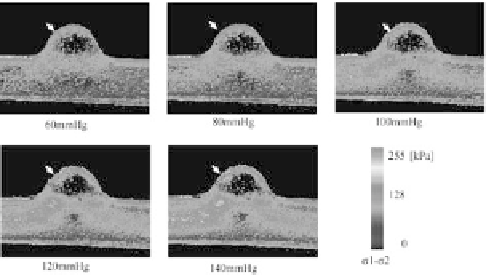
designed location while pressure increases. Photoelastic stress
analysis was applied for measuring the stress variation in the bleb area
for pressure values near human blood pressure limits 60-140 mmHg
showing a local maximum of stress in the bleb area (Fig. 6.18).
Figure 6.17
Saccular aneurysm model with bleb deformation with inner
pressure, the bleb area is pointed with an arrowhead in all
images.
Figure 6.18
Photoelastic stress analysis in the saccular aneurysm model
with bleb for pressures within the range of 60-140 mmHg.
Arrows point at the bleb area.


Search WWH ::

Custom Search