Biomedical Engineering Reference
In-Depth Information
distribution change in blood vessel model wall during human blood
pressure simulation, health care specialist training and intravascular
tools evaluation. ML-EM is an iterative method that reconstructs the
cross section of an object from the sinogram of a slice of the object
and an initial guess of the cross section. The sinogram is an image
where each row
a
represents a direction, each column
b
a spatial
coordinate of the studied cross section, and color represents the
object thickness. Let us name the image
B
0
the initial guess of the
object cross section, and
B
k
the result image of the reconstruction
process at iteration
k
. For recording the sinograms of vasculature
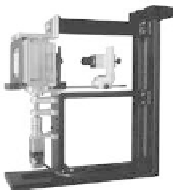
phantoms a three-dimensional scanner was constructed. The
polariscope shown in Fig. 4.6 and a camera were attached to a
glycerine tank. This structure has its rotation axis aligned to the tank's
vertical axis, enabling to register the sinograms by scanning in 360
°
a
phantom submerged into the tank (Fig. 4.20). A multilayer phantom
representing a straight segment vasculature was submerged into
the tank, concentric to the tank rotation axis. For this experiment,
pressure inside the model was set at three levels
P
1
=
80
mmHg,
P
2
=
mmHg and
P
3
mmHg. For each pressure, two sets of
images were recorded: A irst scan was performed with a blue ilter
instead of the polariscope to obtain in a range of 180
°
128 source
images of the optical path length (OPL) for each slice.
120
=
160
Variable
Retadation
Device
3CCD camera
Phantom
Rotation
Axis
Lens
λ
ex
10mm
Region of Interest
for 3D
Visualization
White Light
Source
3λ
ex
/4
4.6mm
Polarizer
λ
ex
/2
Glycerin
Inmersion
Tank
Motor
λ
ex
/4
1
mm
100mm
0λ
ex
5mm
a)
b)
c)
Figure 4.20
Scanner for building the sinogram of each slice of the model
of vasculature submerged into the glycerin tank. (a) Studied
slices for the three-dimensional visualization of stress over a
source image sample for optical path length calculation. (b)
Retardation of green light produced by stress in the model
wall.
From them, the sinograms
A
n
P
of slice
n
at pressure
P
were built
for each pressure and slice. Then a second scan was done with the
polariscope in place for the same directions to register the green


Search WWH ::

Custom Search