Biomedical Engineering Reference
In-Depth Information
4.14 than in Fig. 4.16. As seen in Fig. 4.14, the correction method
preserved local maxima and minima of stress. This characteristic
is essential to quantify the stress produced by medical tools on the
blood vessel wall. As we can see in Fig. 4.14, there is a weak area in
the model wall near the right side of the ROI. At that point, the wall
gets thinner and produces a stress local maximum, the size of this
local maximum increasing with pressure. Stress local minima are
visible where air bubbles were trapped between silicone layers, as
air does not produce retardation of polarized light.
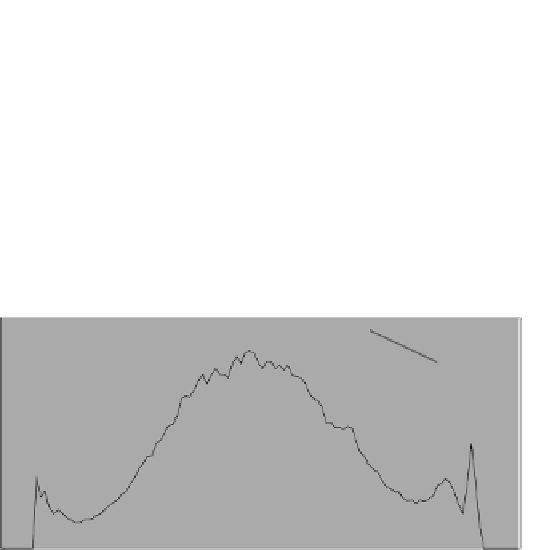
Stress Analysis in Cross-Section of Blood Vessel ( Pressure 189mmHG)
Cross-Section
2400
Border
1600
800
Column of
the ROI
0
20
40
60
80
100
Y axis (Pixel Number)
Figure 4.16
Distortion introduced by the model shape to the stress analysis
and studied cross section of blood vessel. Pressure inside the
model is 189
mmHG.
4.9
Stress Direction Measurements
The method proposed in the previous section allows quantitative
stress analysis for neurovascular simulation, and it is very helpful
for evaluating the performance of instruments. However, inserted
medical instrument are dificult to perceive because generally these
objects are opaque and in the circular polariscope, light penetrates
only through photoelastic materials under stress. Additionally, as Fig.
4.8 shows, stress direction is not practically measurable. To solve this
problem, we propose another polariscope construction shown in Fig.
4.17, adding an extra wave plate at slight inclination between second
set of quarter-wave plates and polarizer. With this construction, the
transit background color from black to violet, remarkably improves
the visibility of inserted surgical instruments, improves the
sensitivity to color transition (color changes from violet to red and


Search WWH ::

Custom Search