Biomedical Engineering Reference
In-Depth Information
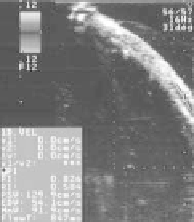
3.40b, and 3.40c are the ultrasonic data measured inside aneurysm,
at the inlet and outlet of aneurysm, respectively. The colored area
indicates the direction of the blood streaming obtained by ultrasound
Doppler method. The red area indicates forward low and the blue
area indicates backward low. Moreover, the low velocity transition
on some local domains obtained by the ultrasonic Doppler method
is shown in Fig. 3.41. The domains for measurement are shown in
Fig. 3.40 by “I” sign. The maximum and minimal low velocities at the
inlet of aneurysm were measured at 170.5 cm/sec and 34.3 cm/s,
respectively. This value is found correctly measured, considering the
inlow rate of the pulsatile pump. Through this experiment, it was
conirmed that the vascular model with membranous structure is
applicable to ultrasound measurement.
a)
b)
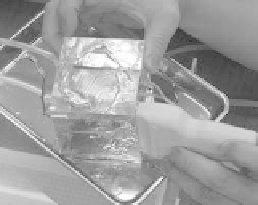
Figure 3.39
Appearance of ultrasound imaging experiment: (a) Ultrasound
imaging for solid vascular model of case No. 2. (b) Ultrasound
imaging for membranous vascular model of case No. 2.
a)
b)
c)
Figure 3.40
Ultrasound image obtained for the membranous model of
representative case No. 2. Colored area indicates the direction
of the blood streaming obtained by ultrasound Doppler method
(red area indicates forward low and blue area indicates
backward low). Ultrasound images: (a) Inside the aneurysm.
(b) At the inlet of aneurysm. (c) At the outlet of aneurysm. See
also Color Insert.


Search WWH ::

Custom Search