Biomedical Engineering Reference
In-Depth Information
F
p1
gn2
F
p2
gn1
gn3
F
gs
F
g0
0
0
T
1
T
2
Time
F
t0
F
p3
tn3
F
ts
tn2
tn1
0
0
T
3
T
4
Time
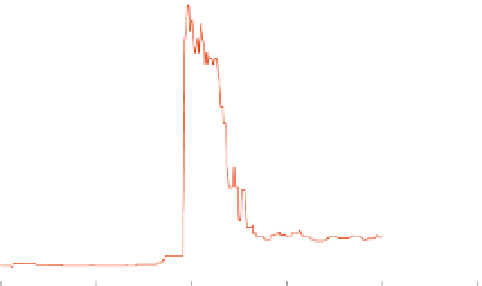
1200
1000
800
600
400
200
0
0
0.05
0.1
0.15
0.2
0.25
Time (s)
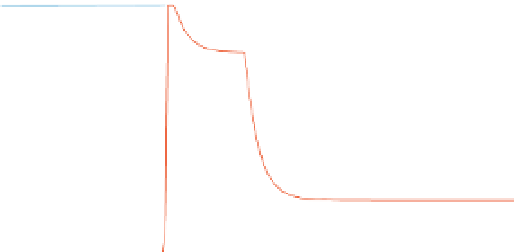
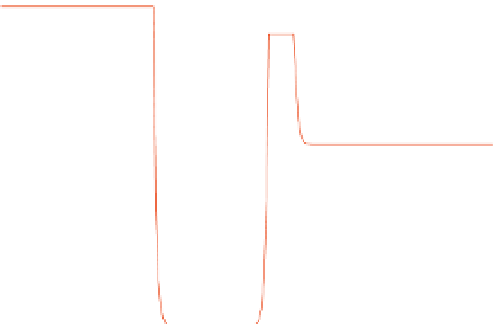
FIGURE 13.47
Neural input to the horizontal saccade system. (Top) Agonist input. (Middle) Antagonist input.
(Bottom) Discharge rate of a single burst-tonic neuron during a saccade (agonist input). Details of the experiment
and training for the bottom diagram are reported elsewhere.