Biomedical Engineering Reference
In-Depth Information
K
lt
F
B
x
2
K
se
x
1
T
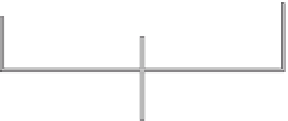
FIGURE 13.24
A muscle model consisting of an active-state tension generator
F,
in parallel with a length-
tension elastic element
K
lt
, and viscous element
B
, connected to a series elastic element
K
se
. The passive elastic
element
K
pe
has been removed from the model for simplicity. Upon stimulation of the active-state tension
generator
F
, a tension
T
is exerted by the muscle.
tension as indicated. The force-velocity characteristics in Figure 13.23 are similar to those
shown in Figure 13.22. In particular, the slope of the force-velocity curve for a small value
of active-state tension is quite different from that for a large value of the active-state tension
in the operating region of the eye muscle (i.e., approximately 800
/s).
To include the effects of viscosity from the isotonic experiment in the muscle model, a
viscous element is placed in parallel with the active-state tension generator and the length
tension elastic element as shown in Figure 13.24. The impact of this element is examined
by analyzing the behavior of the model in Example Problem 13.5 by simulating the condi-
tions of the isotonic experiment. At this stage, it is assumed that the viscous element is
linear in this example. For simplicity, the lever is removed along with the virtual acceler-
ation term
M
‥
1
. A more thorough analysis including the lever is considered later in this
chapter. For simplicity, the passive elastic element
K
pe
is removed from the diagram and
analysis.
EXAMPLE PROBLEM 13.5
Consider the system shown in Figure 13.25 that represents a model of the isotonic experiment.
Assume that the virtual acceleration term
M
‥
1
can be ignored. Calculate and plot maximum
velocity as a function of load.
Solution
Assume that
x
2
>
x
1
, and that the mass is supported so
x
1
>
0. Summing the forces acting on
nodes 1 and 2 gives
Continued