Biomedical Engineering Reference
In-Depth Information
Muscle Length
Muscle
Weight
t
1
t
2
Time
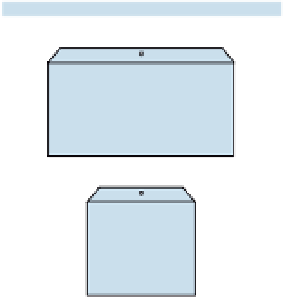
FIGURE 13.17
The quick release experiment. The figure on the left depicts the physical setup of the experi-
ment. The figure on the right shows typical data from the experiment. At time
t
1
the muscle is fully stimulated,
and at time
t
2
the weight is released.
T
x
K
se
K
pe
F
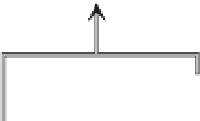
FIGURE 13.18
A muscle model consisting of an active-state tension generator
F
, passive elastic element
K
pe
,
and series elastic element
K
se
. Upon stimulation of the active-state tension generator
F
, a tension
T
is exerted by
the muscle.
investigators argue that this element is nonlinear, we will assume that it is linear for
simplicity. The updated muscle model is shown in Figure 13.18.
Based on the experiment carried out by Collins in 1975 on rectus eye muscle, an estimate
for
was given as 125 N/m (2.5 gm/
). Since the value of
K
se
K
se
does not equal the value of
K
, another elastic element is needed to account for this behavior.
Length Tension Elastic Element
Given the inequality between
K
se
and
K
, another elastic element, called the length-tension
elastic element,
, is placed in parallel with the active-state tension element as shown in
the illustration on the left in Figure 13.19. For ease of analysis,
K
lt
is subtracted out
(removed) using the graphical technique shown in Figure 13.15. To estimate a value for
K
lt
, the muscle model shown on the right in Figure 13.19 is analyzed and reduced to an
expression involving
K
pe
K
lt
. Analysis begins by summing the forces acting on nodes 1 and 2.