Biomedical Engineering Reference
In-Depth Information
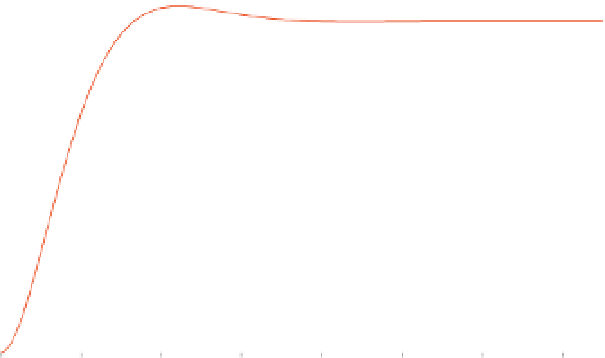
EXAMPLE PROBLEM 13.4
Simulate a 20
saccade using the Westheimer saccade model. Plot position versus time.
Solution
The Laplace transform of the Westheimer saccade model with a step input is
o
2
n
K
g
s
and based on the model, the SIMULINK program is shown in Figure 13.8 (top). Using the pa-
rameters given by Westheimer, z ¼
y ðÞ¼
H
ðÞtð
s
Þ¼
s
2
þ
2zo
n
s
þ o
2
n
20, the response is shown
in Figure 13.8 (bottom). Notice that the response is underdamped as expected and that
0
:
7 and o
n
¼
120, and the input g ¼
T
p
¼
37 ms.
Time
Clock
To Workspace1
+
-
-
1
s
Integrator1
1
s
Integrator
-K-
Step
Gain1
Sum
Position
Gain
To Workspace
0.0141
Scope
25
20
15
10
5
0
0
0.02
0.04
0.06
0.08
0.1
0.12
0.14
Time (s)
FIGURE 13.8
SIMULINK program and response for Example Problem 13.4.