Biomedical Engineering Reference
In-Depth Information
The SIMULINK program for an action potential is shown in Figures 12.29 to 12.32. The block
diagram is created by solving for the highest derivative term in Eq. (12.47),whichyields
Eq. (12.48). The SIMULINK program is then created by using integrators, summers, and so on.
dV
m
dt
¼
1
C
m
ð
I
m
þ
G
K
E
K
V
m
ð
Þþ
G
Na
E
Na
V
m
ð
Þþ
G
l
E
l
V
m
ð
Þ
Þ
ð
12
:
48
Þ
Figure 12.25 shows the main block diagram. Figures 12.29 to 12.31 are subsystems that
were created for ease in analysis. The Workspace output blocks were used to pass simula-
tion results to MATLAB for plotting. Parameter values used in the simulation were based
1
R
l
¼
G
K
¼
10
3
S,
on the empirical results from Hodgkin and Huxley, with
G
l
¼
0
:
3
36
G
Na
¼
10
3
S,
10
3
S,
10
3
V,
10
3
V,
10
3
V,
120
E
K
¼
72
E
l
¼
49
:
4
E
Na
¼
55
Time
Output Time to MATLAB Workspace
Clock
Vm
Output Vm to MATLAB Workspace
Im
dVm/dt
Cmd Vm/d
t
Vm
1
Stimulus Current
-K-
1/Cm
s
Vm
Sum
1000
V in mV
Gl*(El-u)
.060
|Vrp|
Ek-u
Gkbar*n^4
Gnabar*m^3*hV
Na and K conductances
Ena-u
FIGURE 12.29
Main block diagram for simulating an action potential using SIMULINK. The stimulus current
is a pulse created by subtracting two step functions as described in Figure 12.30. The
Na
þ
and
K
þ
conductance
function blocks are described in Figures 12.31 and 12.32.
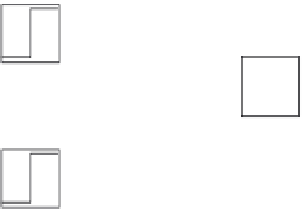
Positive Step
1
Im
Negative Step
FIGURE 12.30
The stimulus current.


