Biomedical Engineering Reference
In-Depth Information
0.04
0.035
+20mv
0.03
0.025
0mv
0.02
0.015
−
20mv
0.01
0.005
−
40mv
−
50mv
0
0
0.001
0.002
0.003
0.004
0.005
Time (s)
0.03
0.025
+20 mV
0.02
0 mV
0.015
0.01
−
20 mV
0.005
−
40 mV
−
50 mV
0
0
0.002
0.004
0.006
0.008
0.01
Time (s)
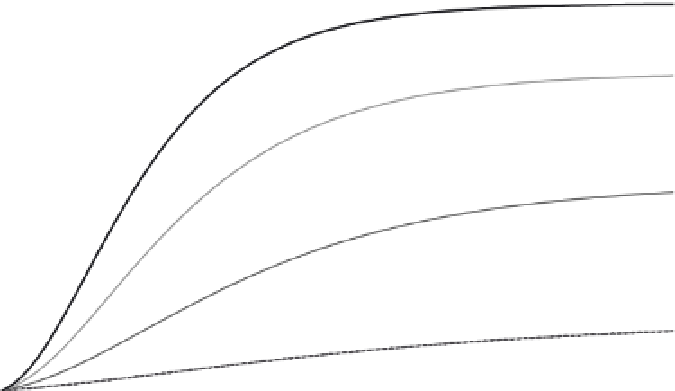
FIGURE 12.26
Diagram illustrating the change in
Na
þ
and
K
þ
conductance with clamp voltage ranging from
50 mV (below threshold) to
þ
20 mV. Note that the time scales are different in the two conductance plots.
K
þ
channels remain open while the voltage clamp is maintained. Once the
Na
þ
channels
close, they cannot be opened until the membrane has been hyperpolarized to its resting
potential. The time spent in the closed state is called the refractory period. If the voltage
clamp is turned off before the time course for
Na
þ
is complete (returns to zero),
G
Na
almost
immediately returns to zero, and
G
K
returns to zero slowly regardless of whether the time
Na
þ
is complete.
course for