Biomedical Engineering Reference
In-Depth Information
5
0
−
2
−
1
0
1
2
Time (sec)
(a)
4
3
2
1
0
−
1
−
2
−
5
−
4
−
3
−
2
−
1 0
Frequency (Hz)
1
2
3
4
5
(b)
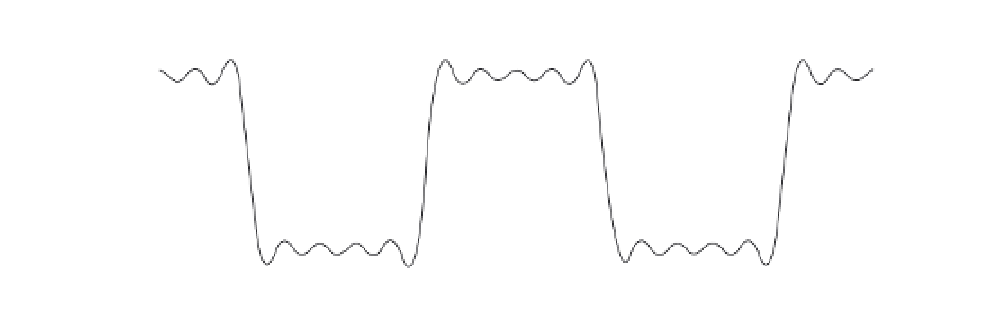
FIGURE 11.9
(a) MATLAB result showing the first ten terms of exponential Fourier series approximation
for the square wave. (b) The compact Fourier coefficients are shown as a function of the harmonic frequency.
Note that both negative and positive frequencies are now necessary to approximate the square wave signal.
In practice, many periodic or quasi-periodic biological signals can be accurately approxi-
mated with only a few harmonic components. Figures 11.10 and 11.11 illustrate a harmonic
reconstruction of an aortic pressure waveform obtained by applying a Fourier series
approximation. Figure 11.10 plots the coefficients for the cosine series representation as a
function of the harmonic number. Note that the low-frequency coefficients are large in
amplitude, whereas the high-frequency coefficients contain little energy and do not contrib-
ute substantially to the reconstruction. The amplitude coefficients,
, are plotted on a log
10
scale so the smaller values are magnified and are therefore visible. Figure 11.11 shows sev-
eral levels of harmonic reconstruction. The mean plus the first and second harmonics pro-
vide the basis for the general systolic and diastolic shape, since the amplitudes of these
harmonics are large and contribute substantially to the reconstructed waveform. Additional
harmonics add fine details but do not contribute significantly to the raw waveform.
A
m
11.5.4 Fourier Transform
In many instances, conceptualizing a signal in terms of its contributing cosine or sine
functions has various advantages. The concept of frequency domain is an abstraction that