Biomedical Engineering Reference
In-Depth Information
360 Hz Signal,T=.005 s
1
0.5
0
−
0.5
−
1
0
0.005
0.01
0.015
0.02
0.025
40 Hz Signal, T=.005 s
1
0.5
0
0.5
−
−
1
0
0.005
0.01
0.015
0.02
0.025
TIME (s)
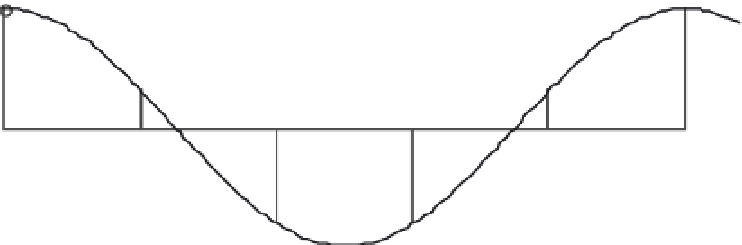
FIGURE 11.6
A 360 Hz sine wave is sampled every 5 ms—that is, at 200 samples/s. This sampling rate will
adequately sample a 40 Hz sine wave but not a 360 Hz sine wave.
11.5 FREQUENCY DOMAIN REPRESENTATION
OF BIOLOGICAL SIGNALS
In the early nineteenth century, Joseph Fourier laid out one of the most important the-
ories on the field of function approximation. At the time, his result was applied toward
the problem of heat transfer in solids, but it has since gained a much broader appeal. Today,
Fourier's findings provide a general theory for approximating complex waveforms with
simpler functions that has numerous applications in mathematics, physics, and engineer-
ing. This section summarizes the Fourier transform and variants of this technique that play
an important role in the analysis and interpretation of biological signals.
11.5.1 Periodic Signal Representation: The Trigonometric Fourier Series
As an artist mixes oil paints on a canvas, a scenic landscape is meticulously recreated by
combining various colors on a palate. It is well known that all shades of the color spectrum