Biomedical Engineering Reference
In-Depth Information
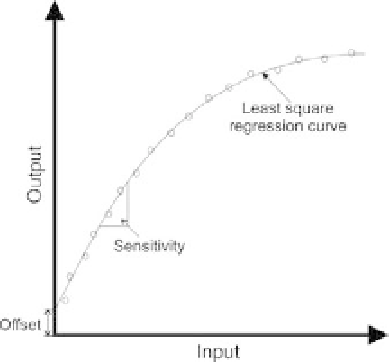
FIGURE 10.1
Input versus output calibration curve of a typical sensor.
V/
C; that is, the output
For example, a temperature sensor may have a sensitivity of 20
m
V for 1
C change in input temperature. Note that if the
calibration line is linear, the sensitivity is constant, whereas the sensitivity will vary with
the input when the calibration is nonlinear, as illustrated in Figure 10.1. Alternatively,
sensitivity can also be defined as the smallest change in the input quantity that will result
in a detectable change in sensor output.
of this sensor will change by 20
m
Range
The
of a sensor corresponds to the minimum and maximum operating limits that
the sensor is expected to measure accurately. For example, a temperature sensor may have
a nominal performance over an operating range of
range
500
C.
200 to
þ
Accuracy
Accuracy
refers to the difference between the true value and the actual value measured
by the sensor. Typically, accuracy is expressed as a ratio between the preceding difference
and the true value and is specified as a percent of full-scale reading. Note that the true
value should be traceable to a primary reference standard.
1
Precision
Precision
refers to the degree of measurement reproducibility. Very reproducible read-
ings indicate a high precision. Precision should not be confused with accuracy. For exam-
ple, measurements may be highly precise but not necessary accurate.
Resolution
When the input quantity is increased from some arbitrary nonzero value, the output of a
sensor may not change until a certain input increment is exceeded. Accordingly,
resolution
is defined as the smallest distinguishable input change that can be detected with certainty.
1
An independently calibrated reference obtained by an absolute measurement of the highest quality that is
subsequently used in the calibration of similar measured quantities.