Biomedical Engineering Reference
In-Depth Information
The same approach can be used to find the quantities in the other compartments, which are
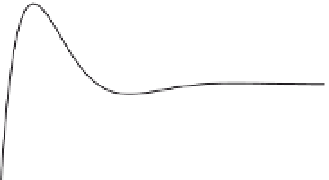
plotted in Figure 7.29. Note that the oscillation about the steady state of 1 is more pronounced
in
q
4
than
q
3
. In fact, the prominence of oscillation about steady state decreases as we move from
q
4
to
q
3
. In general, we see the most prominent oscillation in the compartment that
receives the solute from the compartment stimulated by the bolus. Also note that the steady-state
quantity in each compartment equals one.
q
5
to
q
1
to
q
2
to
1.5
1.5
1
1
0.5
0.5
0
0
0
1
2
3
4
5
0
1
2
3
4
5
Time
-0.5
Time
5
2.00
4
1.50
3
1.00
2
0.50
1
0
0.00
0
1
2
3
4
5
0
1
2
3
4
5
Time
Time
1.50
1.00
0.50
0.00
0
1
2
3
4
5
Time
FIGURE 7.29
Plots of the responses for Example Problem 7.17.
As we increase the number of compartments in a closed unilateral system, in general, the
more oscillatory the response becomes. In some cases, the oscillatory behavior is prominent
but lasts only a very short time. In other cases, the oscillations may be less prominent but
last for a longer period of time. Consider the closed system unilateral model shown in


