Biomedical Engineering Reference
In-Depth Information
4
3.5
3
2.5
2
1.5
1
0.5
0
0
0.5
1
1.5
2
Time
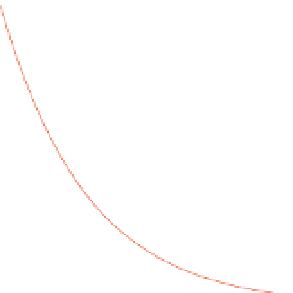
FIGURE 7.12
Illustration of change in quantity due to repeated bolus injections using a one-compartment
model. Values used: z ¼
1,
K
10
¼
3, and
T
¼
0.1.
EXAMPLE PROBLEM 7.6
A 3 g bolus of antibiotic is administered to a human with a plasma volume of 3 L. The average
impulse response for this drug is shown in Figure 7.13. Assuming a one-compartment model, deter-
mine the transfer rate. If the concentration of the drug is not to fall below 30 percent of the initial
dosage at steady state, how often does the drug need to be given to maintain this minimum level?
Solution
To determine the transfer rate,
K
10
, the curve in Figure 7.13 is used to determine the half-life,
ln 2
ðÞ
K
10
which is approximately
t
2
¼
1
:
4. Using Eq. (7.4.2),
t
2
¼
1
:
4
¼
,
K
10
is found as
ln 2
ðÞ
K
10
¼
'
0
:
5
1
:
4
1
0.9
0.8
0.7
0.6
0.5
0.4
0.3
0.2
0.1
0
0
2
4
6
8
10
Time, hours
FIGURE 7.13
Illustration for Example Problem 7.6 with 3 g bolus in a 3 L plasma compartment.