Biomedical Engineering Reference
In-Depth Information
4.7.4 Cardiovascular Mechanics
This concise generalized pressure model of the left ventricle (Eq. (4.75)) was coupled to
the reduced arterial load model of Figure 4.37 and allowed to eject blood. Model parameter
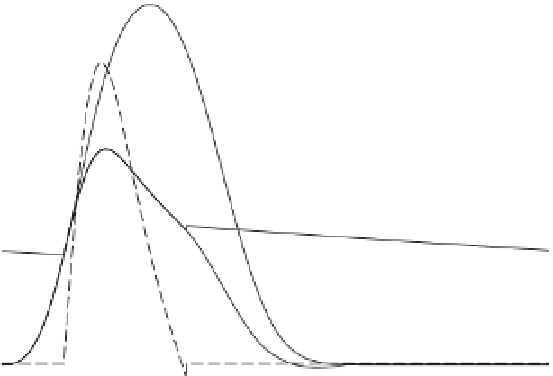
values for a normal arterial load are given in Table 4.4. Figure 4.43 shows results for a
normal canine left ventricle ejecting into a normal arterial system. The solid curves (left
ordinate) describe ventricular pressure
and root aortic pressure as functions of time.
Clinically, arterial pressure is reported as two numbers—for example, 110/60. This corre-
sponds to the maximum and minimum root arterial pulse pressures—in this case, about
120/65 mmHg. The dashed curve (right ordinate) shows ventricular outflow. The ventricle
was filled with an end-diastolic volume of 45 ml, and it ejected 30 ml (stroke volume),
giving an ejection fraction of 66 percent, which is about normal for this size animal.
The same ventricle may be coupled to a pathological arterial system—for example, one
with doubled peripheral resistance
p
v
R
s
. This change is equivalent to narrowed blood vessels.
TABLE 4.4
Representative Systemic Arterial Model Element Values
Element
Symbol
Control Value
Characteristic aorta impedance
Z
0
0.1 mmHg-s/ml
Systemic arterial compliance
C
s
1.5 ml/mmHg
Peripheral arterial resistance
R
s
1.0 mmHg-s/ml
200
300
180
250
160
Ved = 45ml
SV = 30ml
EF = 66%
140
200
120
150
100
80
100
60
40
50
20
0
0
0
0.25
0.5
0.75
1
Time [s]
FIGURE 4.43
Ventricular and root aortic pressures (solid curves, left ordinate) and ventricular outflow (dashed
curve, right ordinate) computed using the model of Eq. (4.75) for a normal canine left ventricle pumping into a
normal arterial circulation. The topmost solid curve corresponds to a clamped aorta (isovolumic). The ventricle
has initial volume of 45 ml and pumps out 30 ml, for an ejection fraction of 66 percent, which is about normal.