Biomedical Engineering Reference
In-Depth Information
mmHg
150
100
50
sec
0
0.0
0.2
0.4
0.6
Time
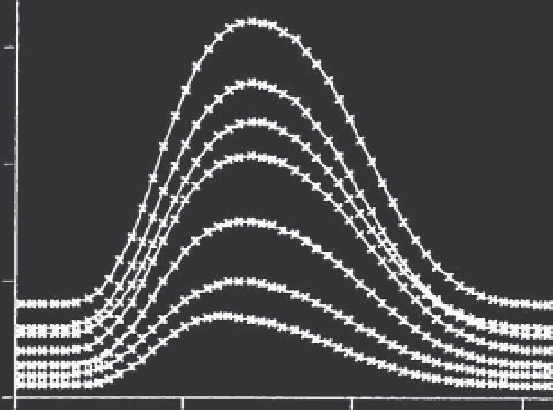
FIGURE 4.41
Isovolumic ventricular pressure curves. For each curve, the left ventricle is filled with a fixed ini-
tial volume, the heart is stimulated, and generated ventricular pressure is measured with respect to time. Other
curves arise from different fixed initial volumes.
where
,
t
p
, t
c
, t
r
,anda were derived from the isolated canine ventricle experiments. Physiologically,
Eq. (4.76) says that the ventricle is a time- and volume-dependent pressure generator. The term
to the left of the plus sign, including constants
f
(
t
) is the activation function in square brackets in Eq. (4.75). The constants
a
,
b
,
c
,
d
a
and
b
, describes the ventricle's passive elastic
properties. The term to the right, including
, describes its active elastic properties, aris-
ing from the active generation of force in the underlying heart muscle. Representative model
quantities measured from canine experiments are given in Table 4.3. This model was adapted
to describe the human left ventricle using quantities in the right-hand column [24, 25].
c
and
d
TABLE 4.3 Ventricle Model Quantities Measured from Animal Experiments and Adapted for the Human
Analytical Model
Quantity
Dog (Measured)
Human (Adapted)
0.003 [mmHg/ml
2
]
a
0.0007
b
1.0 [ml]
20.0
c
3.0 [mmHg/ml]
2.5
d
20.0 [mmHg]
80.0
t
c
0.164 [s]
0.264
t
p
0.271 [s]
0.371
t
r
0.199 [s]
0.299
t
b
0.233 [s]
0.258
a
2.88
2.88