Biomedical Engineering Reference
In-Depth Information
-0.55
HEKF
DEKF
Measurement
-0.6
-0.65
-0.7
-0.75
-0.8
-0.85
-0.9
-0.95
2.52
2.525
2.53
2.535
x 10
4
Data Time Index (Second)
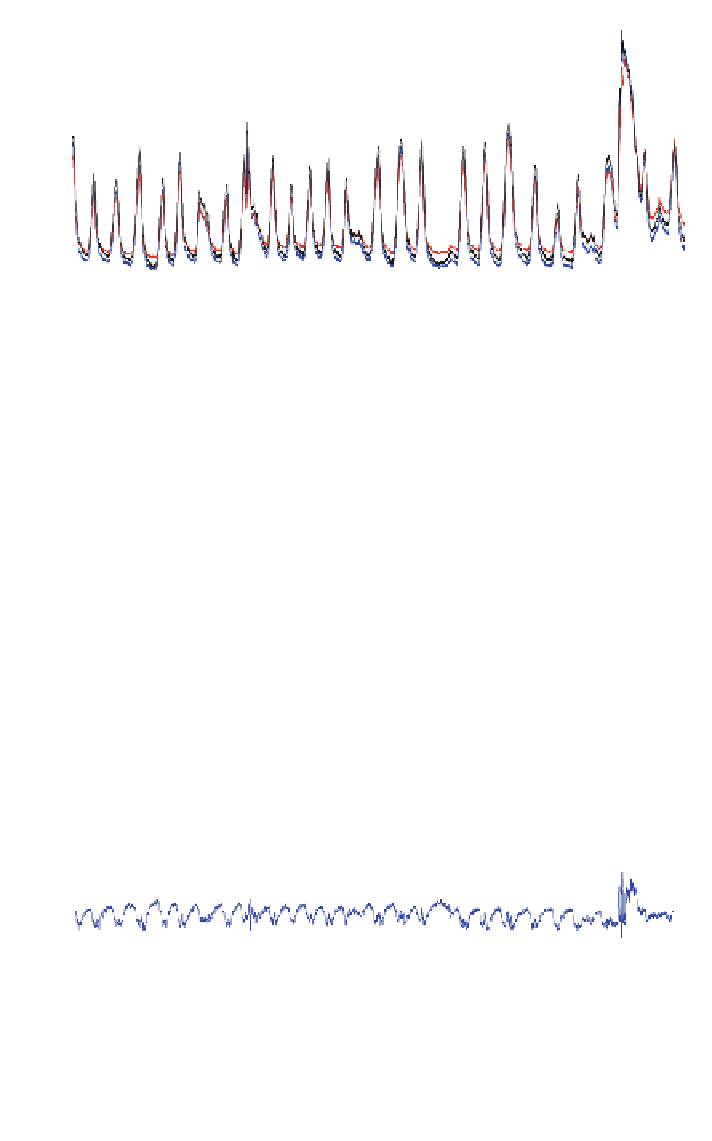
Fig. 4.8 Target estimation between HEKF and DEKF. This figure shows that the position
estimation values of HEKF align closer to the measurement values than DEKF values
(2) Position Error Value
We would like to compare the performance of tracking errors with respect to
the data time index across the entire measurement period between HEKF and
DEKF. The error value in Fig.
4.9
was calculated by the subtraction of the 3D
Euclidian distance between the predicted values and the measurement values in the
data time index.
Figure
4.9
shows that the error value of HEKF is smaller than that of DEKF
across the data time index 25200-25350 s. At the beginning of tracking estima-
tion, we notice that both approaches have several overshoot across the data time
0.08
HEKF
DEKF
0.06
0.04
0.02
0
-0.02
Significant Position
Error
-0.04
-0.06
-0.08
2.52
2.525
2.53
2.535
x 10
4
Data Time Index (Second)
Fig. 4.9 Comparison of position error between HEKF and DEKF. This figure shows two
significant position errors in DEKF, whereas the position error is negligible in HEKF


Search WWH ::

Custom Search