Biomedical Engineering Reference
In-Depth Information
80
70
Min of
γ
i
= 0.02
Max of
γ
i
= 1
Mean of
γ
i
= 0.92
60
50
40
30
20
10
0
0
0.2
0.4
0.6
0.8
1
Ratio (
γ
i
)
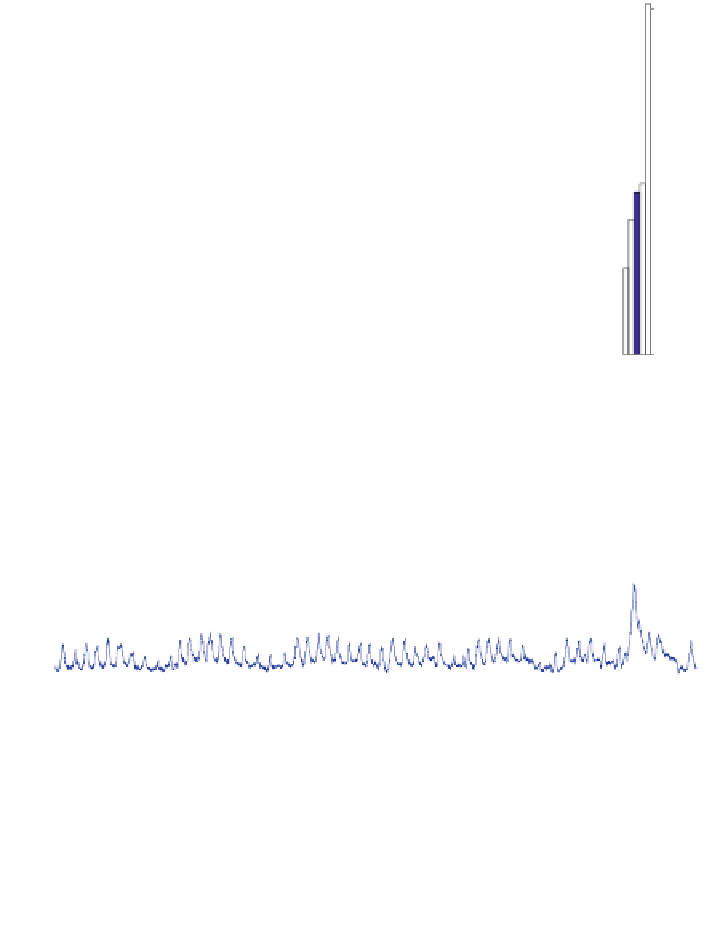
Fig. 6.10 Frequency distribution of ratio c
ðÞ
. Here c
i
is the ratio of the true negative range (R
i
TN
)
to the period of observation (T
i
), thus it is dimensionless. The ratio c
ðÞ
for each breathing dataset
is distributed from 0.02 to 1 with 0.92 as the average ratio value
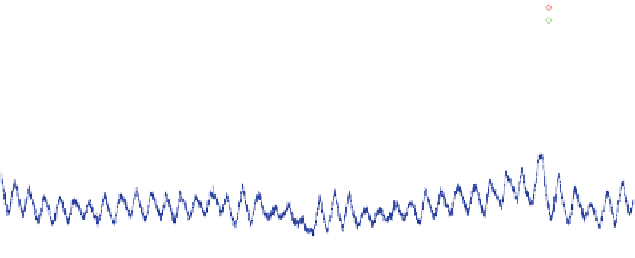
(a)
-1561
Breathing curv
e
Extrema
Irregular point
Patient i = 1,
γ
1
=0.98
Regular Breathing Pattern
-1562
-1563
-1564
-1565
-1566
2.505
2.51
2.515
2.52
Data Time Index(Second)
(b)
x 1
0
4
-1662.5
Patient i = 177,
γ
177
=0.98
Regular Breathing Pattern
Breathing curve
Extrema
Irregular point
-1663
-1663.5
-1664
-1664.5
1.61
1.615
1.62
1.625
x 10
4
Data Time Index(Second)
Fig. 6.11 Representing regular breathing patterns, a patient number 1 with the ratio c
i
¼
0
:
98,
and b patient number 177 with the ratio c
177
¼
0
:
98
Figure
6.12
shows gray-level breathing patterns in the given datasets. Even
though the gray-level breathing patterns show some consecutive irregular points, the
overall breathing patterns are almost identical as shown in Fig.
6.12
. Figure
6.13
shows irregular breathing patterns in the given datasets. Note that the breathing
pattern in Fig.
6.13
b with a very low ratio c
317
¼
0
:
5
ð Þ
is void of regular patterns
and that there exists a mass of irregular breathing points in Fig.
6.13
.


Search WWH ::

Custom Search