Biomedical Engineering Reference
In-Depth Information
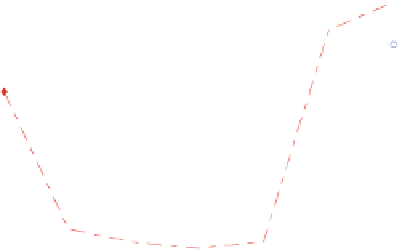
5000
AIC
BIC
4500
4000
3500
3000
2500
2000
1500
2
3
4
5
6
7
8
Number of Cluster (M)
Fig. 6.7
Quantitative model analysis for the selection of cluster number
minima. Figure
6.8
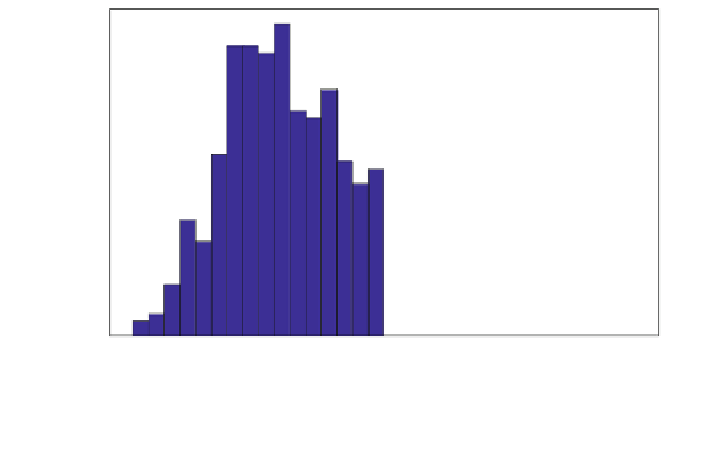
shows the frequency distribution of BC
i
for the breathing
datasets. The breathing cycles are distributed with a minimum of 2.9 s/cycle and a
maximum of 5.94 s/cycle. The average breathing cycle of the breathing datasets is
3.91 s/cycle.
There are yet no gold standard ways of labeling regular or irregular breathing
signals. Lu et al. showed, in a clinical way, that moving average value can be used
to detect irregular patterns, where inspiration or expiration was considered as
irregular if its amplitude was smaller than 20 % of the average amplitude [
7
].
45
40
Min = 2.9 seconds/cycle
Max = 5.94 seconds/cycle
Mean = 3.91seconds/cycle
35
30
25
20
15
10
5
0
3
3.5
4
4.5
5
5.5
6
Breathing Cycle (BC
i
)
Fig. 6.8 Frequency distribution of breathing cycle (BC
i
) for the breathing datasets. The
breathing cycles are variable from 2.9 to 5.94 s/cycle, with 3.91 s/cycle as the average time


Search WWH ::

Custom Search