Biomedical Engineering Reference
In-Depth Information
-1688
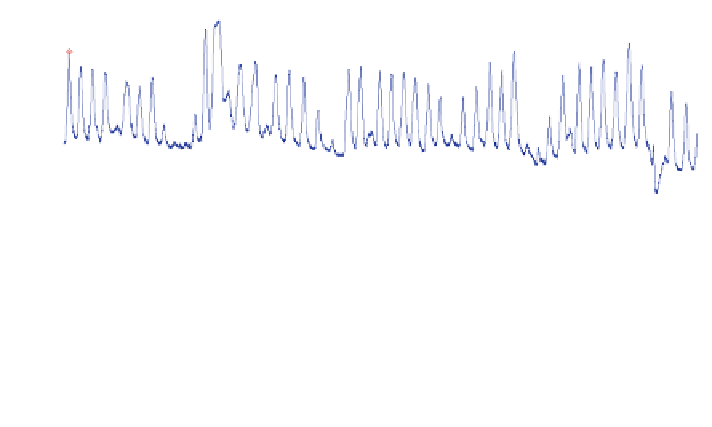
Breathing curve
Extrema
BC
i
=4.69, T
i
=250.92,
Σ
j
ψ
ij
=26
R
i
TP
=60.98, R
i
-1690
TN
=189.94
Ratio(
γ
i
)=0.75
-1692
-1694
-1696
-1698
Irregular
-1700
BC
i
T
i
-1702
-1704
2.845
2.85
2.855
2.86
2.865
2.87
x 10
4
Data Time Index(Second)
Fig. 6.4 True positive range (R
TP
) versus true negative range (R
TN
). This figure shows how to
decide R
TP
or R
TN
of patient i (DB17). In this example, the breathing cycle (BC
i
), the period of
observation (T
i
), and the sum of w
i
i
P
j
w
ij
are given by the numbers of 4.69, 250.92, and 26,
respectively. Accordingly, we can calculate the ratio c
ðÞ
of the true negative range
i
to the
period of observation (T
i
), i.e., 0.75. That means 75 % of the breathing patterns during the
observation period show regular breathing patterns in the given sample
R
TN
Table
6.1
and w
i
as the number of irregular breathing pattern region between a
maximum (peak) and a minimum (valley).
For the patient i, we define the true positive/negative ranges
R
T
i
R
TN
and the
i
regular ratio c
ðÞ
as follows:
¼
BC
2
P
j
P
j
c
i
¼
R
TN
R
TP
i
R
TN
i
¼
T
i
BC
i
2
w
ij
;
w
ij
;
i
T
i
;
ð
6
:
19
Þ
where the ratio c
ðÞ
is variable from 0 to 1. For the semi-supervised learning of the TP
and TN in the given patient datasets, we used the ratio c
ðÞ
of the true negative range
R
TN
i
to the period of observation (T
i
)inEq. (
6.19
). Let us denote Wth as the regular
threshold to decide whether the patient dataset is regular or not. For patient i,we
would like to decide TP or TN based on values with the ratio c
ðÞ
and the regular
threshold Wth
ð Þ
, i.e., if the ratio c
ðÞ
of patient i is greater than the regular threshold
Wt
ð Þ
, the patient is true negative, otherwise c
i
Wt
ð Þ
true positive. We should
notice also that the regular threshold can be variable from 0 to 1. Accordingly, we will
show the performance of sensitivity and specificity with respect to the variable
regular threshold in
Sect. 6.5.5
.
6.4.2 Receiver Operating Characteristics
An Receiver operating characteristics (ROC) curve is used to evaluate irregular
breathing pattern with true positive rate versus regular breathing pattern with false
positive rate. For the concrete analysis of the given breathing datasets, we would
like to show a ROC curve with respect to different regular thresholds. In addition,


Search WWH ::

Custom Search