Biomedical Engineering Reference
In-Depth Information
50 mV
a
I
(LDL)
a
J
(HDL)
8
7
6
5
4
3
2
10
log
a
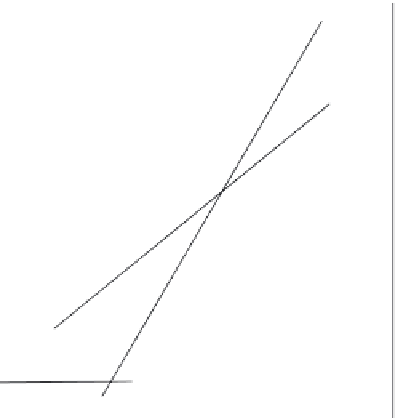
FIGURE 4.5
Typical ISE response curves to monovalent cations (solid circles) with a response slope
of 59.2 mV decade
1
and to divalent cations (open circles) with a Nernstian slope of 29.6 mV decade
1
.
Intercepts of the linear ranges of sensor responses defi ne the lower and higher detection limits.
carrier-based sensors, thus, depends on the strength of the ionophore binding with pri-
mary ions relative to interfering ones and also on the difference in lipophilicities of
the corresponding ions. As the primary and interfering ions may be of different charge
and may form complexes of different stoichiometry, the variation of the ionophore-ion
exchanger ratio in the membrane allows one to optimize the sensor selectivity to some
extent [26]. The selectivity, being an essential sensor characteristic, was traditionally
described by the extended Nernst equation, called the Nikolski-Eisenman equation:
RT
zF
pot
zz
/
EE
0
ln (
a
(aq)
K
a
()
aq
)
(6)
I
J
I
I
I J
J
I
where
K
I
pot
is the potentiometric selectivity coeffi cient. It was later shown that this
semiempirical equation is not valid for
z
I
z
J
in the activity range where both primary
I and interfering J ions signifi cantly contribute to the potential. More complex explicit
equations were derived for each specifi c case of
z
I
and
z
J
, which are beyond the scope
of this chapter [27]. Nonetheless, the Nikolski selectivity coeffi cient remains an excel-
lent measure of ion interference as it describes the selectivity of the membrane in terms
of the equilibrium constant of the exchange reaction of primary and interfering ions
between the organic and aqueous phases (Fig. 4.6).


Search WWH ::

Custom Search