Biomedical Engineering Reference
In-Depth Information
2.5
2.0
0.8
0.7
1.5
0.6
0.5
1.0
0.10
0.15 0.20 0.25
C
glucose
1
/ mM
1
0 2468 0 2 4 6
C
glucose
/mM
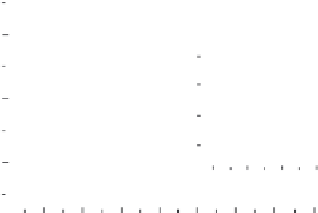
FIGURE 17.5
The calibration curve of the electrocatalytic current on the concentration of glucose. Inset
is the plot of Lineweaver-Burk equation. (From [253], with permission.)
glucose biosensor. Metal oxide nanoparticles are also used to make glucose biosensor
by immobilizing GOD [257]. The
K
m
app
was 7.5 mM for glucose by GOD with TiO
2
nanostructured fi lms.
17.3.2.4 Biosensors based on direct electron transfer of other active enzymes
Besides the enzymes in common use like HRP, Cat and GOD, many other uncommon
enzymes have also been studied to develop biosensors based on their direct electro-
chemistry. Uricase is an enzyme participating in the fi nal step of purine degradation.
Uric acid represents the major catabolite of purine breakdown in humans. For this
reason it remains an important marker molecule for disorders associated with purine
metabolism, most notably gout, hyperuric aemia, and the Lesch-Nyhan syndrome
[258]. Zhang [259] developed a reagentless uric acid biosensor by immobilizing uri-
case on ZnO nanorods. This sensor showed a high thermal stability up to 85ºC and
an electrocatalytic activity to the oxidation of uric acid without the presence of an
electron mediator. Figure 17.6a shows the CV of the uricase/GCE (i), ZnO/GCE (ii),
and uricase/ZnO/GCE (iii) in PBS (pH 6.9); Fig. 17.6b shows the CVs the uricase/
GCE (i), ZnO/GCE (ii), and uricase/ZnO/GCE (iii) in PBS (pH 6.9) containing 5.0
10
4
mol L
1
uric acid. Comparing the three voltammograms, a remarkable electro-
catalytic oxidation of sensor (iii) was observed. The peak current of sensor (iii) reached
to 12.85
µ
A, after calibration by ZnO/GCE (ii) as a blank, which was 11.55
µ
A and
about 8.37 times that (1.38
A) obtained from sensor (i). DPV was used to study the
biosensor. The biosensor has good linear relationship with the uric acid concentration
from the DPV response. The calibrated response to uric acid was linear in the range
of 5.0
µ
10
6
to 1.0
10
3
mol L
1
(
r
0
.
9983). The detection limit was 2.0
10
6
mol L
1
at a signal-to-noise ratio of 3. When the concentration of uric acid was
higher than 1.0
10
3
mol L
1
, a plateau was observed, showing a characteristic of
the Michaelis-Menten kinetic mechanism. The
K
m
app
is estimated to be 0.238 mM.


Search WWH ::

Custom Search