Biomedical Engineering Reference
In-Depth Information
(a)
RBM
(b)
G band
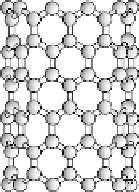
FIGURE 15.18
Schematic picture showing the atomic vibrations for (a) the RBM and (b) the G band
modes. (Reprinted with permission from [128]. Copyright (2003) IOP Publishing Ltd.)
1582
HOPG
1582
MWNT
1592
G
1570
G
SWNT
semicond.
metallic
SWNT
1587
G
G
1550
1450
1550 1650
Frequency (cm
1
)
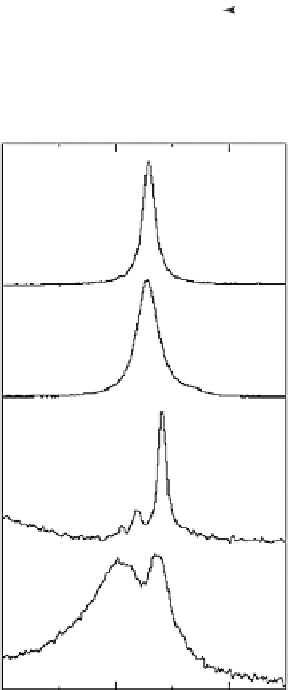
FIGURE 15.19
G band for highly ordered pyrolytic graphite (HOPG), MWNT bundles, one isolated
semiconducting SWNT and one isolated metallic SWNT. (Reprinted with permission from [128]. Copyright
(2003) IOP Publishing Ltd.)
The D band, the disorder induced mode, normally appears between 1250 and
1450 cm
1
. This band is activated in the fi rst-order scattering process of sp
2
carbons
by the presence of in-plane substitutional hetero-atoms, vacancies, grain boundaries or
other defects and by fi nite-size effects [134]. The G
band is the second-order overtone
of the D band.


Search WWH ::

Custom Search