Biomedical Engineering Reference
In-Depth Information
50
(a)
iv
40
30
20
iii
10
ii
i
0
10
0.2
0.4
0.6
0.8
1.0
1.2
E
/V vs SCE
14
(b)
25
12
ii
20
15
10
10
iv
8
5
0
0.2
0.4
0.6
0.8
1.0
1.2
6
E/V vs SCE
iii
4
i
2
0
0.2
0.4
0.6
0.8
1.0
1.2
E
/V vs SCE
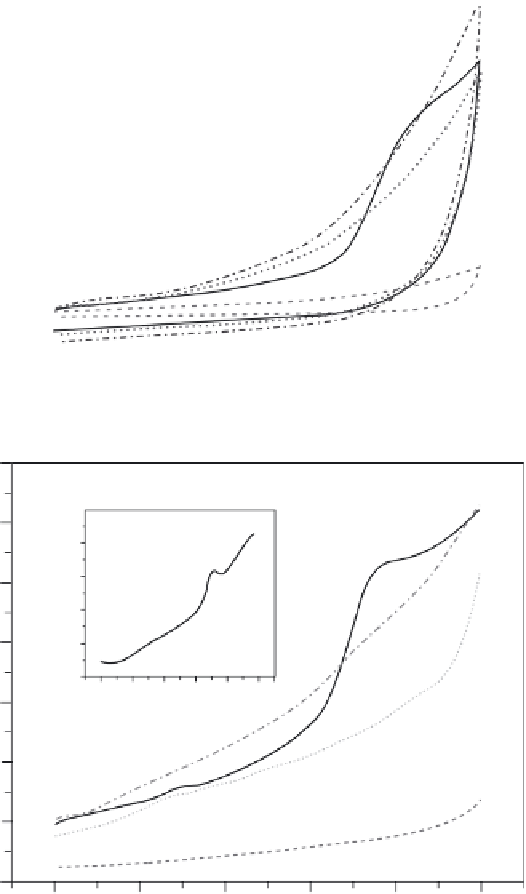
FIGURE 15.12
Cyclic voltammograms (a) and differential pulse voltammograms (b) of 1 mg m
1
DNA
in a 0.1 M phosphate buffer (pH 7.4) at a bare GC electrode (i) and CNT-modifi ed GC electrodes using
CTAB (ii), Triton X-100 (iii), and SDS (iv) as dispersants. The inset in (b) shows a differential pulse voltam-
mogram of 1 µg ml
1
adenine in a 0.1 M phosphate buffer (pH 7.4) at the CNT/CTAB-modifi ed GC elec-
trode. Accumulation time: 5 min. The scan rate of cyclic voltammetry is 0.1 V s
1
. The pulse amplitude of
differential pulse voltammetry is 50 mV, and the pulse width is 50 ms (unpublished results).


Search WWH ::

Custom Search