Biomedical Engineering Reference
In-Depth Information
cells (RASMCs) or with heat-killed cells (Fig. 8.10). Cellular H
2
S consumption rates
were calculated from the slope of the PHSS signal between H
2
S injections, minus the
background rate without cells, and divided by mg protein ml
1
over the 5-200
M
H
2
S range (Fig. 8.10). Aliquots of heat-killed cells were used to determine the non-
enzyme-catalyzed H
2
S oxidation rate associated with cellular constituents. Cellular
H
2
S consumption rate may rely in part on H
2
S-sensitive mitochondrial respiration
and accordingly may exhibit saturation kinetics as a function of H
2
S concentration.
In contrast, spontaneous H
2
S oxidation, which can be catalyzed by several inorganic
and organic trace contaminants in solution [45], exhibits second order kinetics as a
function of both H
2
S and O
2
concentrations, and will become more rapid as O
2
con-
centration increases [36]. Accordingly, to limit spontaneous H
2
S oxidation while
maintaining mitochondrial operation, these experiments were performed at 5 to 15
µ
M
O
2
. Consumption rates were dependent on H
2
S concentration but exhibited saturation
kinetics. At low H
2
S concentrations, cellular consumption rates were approximately
tenfold greater than spontaneous oxidation rates in the absence of cells or in the pres-
ence of heat-killed cells (Fig. 8.10). However, at higher H
2
S concentrations, the spon-
taneous H
2
S oxidation rate approximated the measured rate with cells, indicating that
H
2
S consumption was inhibited at higher H
2
S levels.
H
2
S is both produced and consumed, and consumption pathways may be coupled
to mitochondrial O
2
consumption. However, H
2
S is also toxic to mitochondria, indi-
cating that the steady-state cellular level is under tight control. To determine the H
2
S
µ
800
15
cells
10
NA
2
S,
5
600
M
5
cells
0
0
500
1000
400
Time, s
200
0
0
20
40
60
80
100
Sulfide,
M
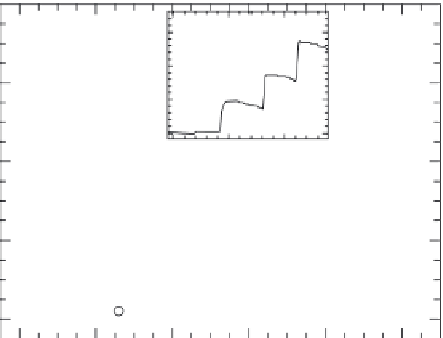
FIGURE 8.10
H
2
S consumption in rat aorta smooth muscle cells (RASMCs). Accumulated data from
several experiments showing RASMC H
2
S consumption rates (fi lled circles and squares) as a function of
H
2
S concentration, compared to H
2
S oxidation rates in solution without cells (open circles and squares).
Heat-inactivated RASMC H
2
S consumption rates (open plus symbols) were equivalent to background rates
without cells. Inset: Representative PHSS traces showing stepwise additions of Na
2
S stock, at arrows, in the
presence (thin line) and absence (thick line) of RASMCs (after [41]).


Search WWH ::

Custom Search