Biomedical Engineering Reference
In-Depth Information
0.6
met Hb I
2.2
10
4
m
m
3 m
0.5
1.4 m
8
Na
2
S
0.4
NO
2 m
6
0.3
1.5
m
1 m
4
0.2
1 m
0.75
m
2
m oxygen
2
0.1
0
0
Time, 200 s
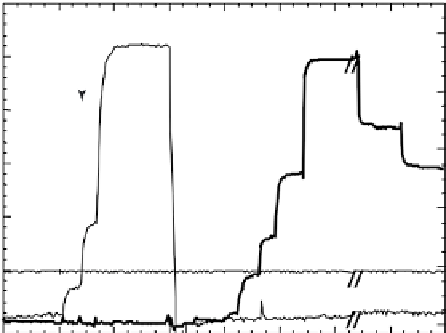
FIGURE 8.5
Multiple-sensor respirometry. Representative calibration traces of PNOS (thin line, left
ordinate) and PHSS (thick line, right ordinate) operating simultaneously in PBS, pH 7.3 at 37ºC, with 50 µM
DTPA in a closed chamber respirometer. After NO additions were made, the chamber solution was replaced
with fresh buffer, to which Na
2
S stock solutions were then injected in a stepwise manner. The stable POS
signal shown at 2 µM O
2
demonstrates that the POS does not respond to NO or H
2
S. Injections of anoxic
buffered NO and H
2
S stocks are shown with concentrations at arrows, as are additions of
Lucina pectinata
ferric hemoglobin I (metHb I), which stoichiometrically binds to H
2
S (after [41]).
500
80
m sulfide
37
°
C
pK ~ 6.8
400
300
200
100
0
6
6.5
7
7.5
8
pH
FIGURE 8.6
pH titration of PHSS signal. A representative graph of pH titration in PBS at 37ºC demon-
strates that the sulfi de species detected is H
2
S and that the pK for H
2
S/HS
is approximately 6.8 under the
conditions tested (after [41]).
at pH 8. However, it is important to carefully control solution pH and to perform PHSS
calibrations at the same pH as the experimental solution.
Solution H
2
S can also be lowered by spontaneous oxidation catalyzed by a number
of compounds in the presence of O
2
. Accordingly, calibration solutions should contain
DTPA and should be sparged with nitrogen or argon to remove O
2
.


Search WWH ::

Custom Search