Biomedical Engineering Reference
In-Depth Information
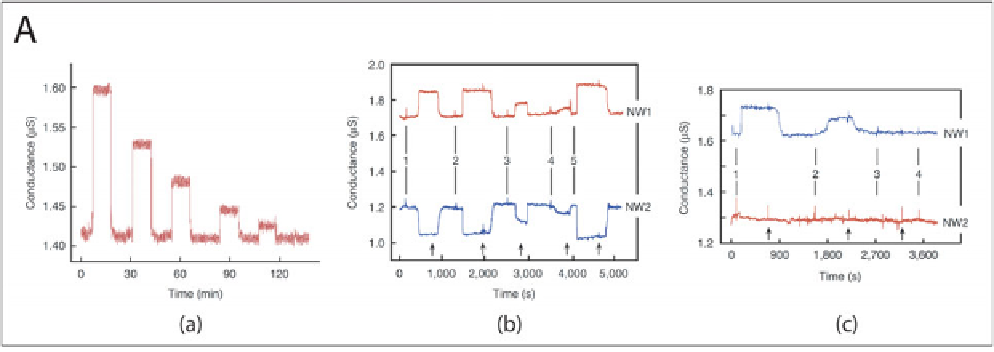
Figure 3. (A) Real-time nanowire sensing results. (a) Conductance versus time data recorded following alternate delivery of PSA and pure buff-
er solutions; the PSA concentrations were 5 ng/ml, 0.9 ng/ml, 9 pg/ml, 0.9 pg/ml, and 90 fg/ml, respectively. The buffer solutions used in all
measurements were 1 mM phosphate (potassium salt) containing 2 mM KCl, pH 7.4. (b) Complementary sensing of PSA using p-type (NW1)
and n-type (NW2) devices. Points 1-5 correspond to the addition of PSA solutions of (1,2) 0.9 ng/ml, (3) 9 pg/ml, (4) 0.9 pg/ml, and (5) 5 ng/ml.
(c) Conductance-versus time data recorded simultaneously from 2 p-type silicon nanowire devices in an array, where NW1 was functionalized
with PSA Ab1, and NW2 was modified with ethanolamine. Points 1-4 correspond to times when solutions of (1) 9 pg/ml PSA, (2) 1 pg/ml PSA,
(3) 10 μg/ml BSA, (4) a mixture of 1 ng/ml PSA and 10 μg/ml PSA Ab1 were delivered.
Search WWH ::

Custom Search