Biomedical Engineering Reference
In-Depth Information
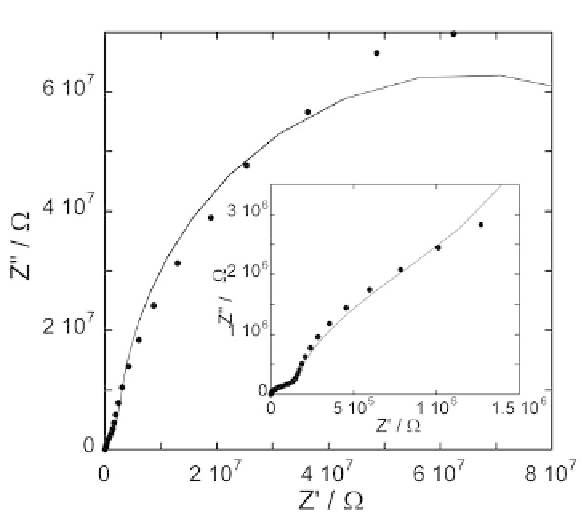
solid curve is the best fit of the equivalent circuit shown in
Fig. 3
to the impedance
spectrum, obtained by using the same
R
and
C
values. The semicircle in the figure
corresponds to the RC mesh of highest time constant and highest resistance, ascrib-
able to the lipoic acid residue. The inset shows an enlargement of the initial portion
of the Nyquist plot.
of
Fig. 4
reveals the presence of two additional partially fused
semicircles.
The solid curve in
Fig. 4
is the best fit of the equivalent circuit
shown in
Fig. 3
to the impedance spectrum. This equivalent circuit
consists of a series of four RC meshes, simulating the lipoic acid
residue, the tetraethyleneoxy hydrophilic spacer, the lipid bilayer
and the aqueous phase bathing the lipid bilayer (see the structure
on top of
Fig. 2
). Note that, in the present case, the combination
(lipoic acid residue + hydrophilic spacer) is no longer simulated by
a pure capacitance, and the aqueous phase is no longer simulated
Search WWH ::

Custom Search