Biomedical Engineering Reference
In-Depth Information
independent of frequency, which would correspond to complete
control by
R
m
. At the same time, I decreases tending to zero.
However, before this can occur, a further decrease in frequency
makes 1
/(
Z
C
s
)
>>
R
m
, causing |
Z
| to coincide with 1
/(
Z
C
s
).
Hence,
the slope of the Bode plot becomes once again equal to -1 and I
tends to 90°. The solid curve in
Fig. 2
is the best fit of the
C
s
(
R
m
C
m
)
R
:
equivalent circuit to the experimental plot. This Bode
plot is rather featureless. A Bode plot richer in features is obtained
by incorporating in the same tBLM the ion carrier valinomycin, a
hydrophobic depsipeptide that cages a desolvated potassium ion
shuttling it across the lipid bilayer.
3
In this case, the I vs. log
f
plot
exhibits an additional hump, as shown in
Fig. 3
. We will show in
what follows that valinomycin allows an additional dielectric slab
of the tBLM to be disclosed.
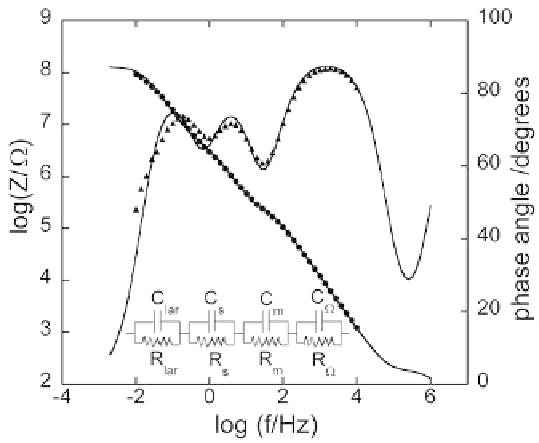
Figure 3. Plot of log|
Z
| (solid circles) and I (solid triangles) against log
f
(Bode plot) for a mercury-supported DPTL|DPhyPC bilayer incorporating
valinomycin from its 1.5u10
-7
M solution in aqueous 0.1 M KCl at -0.375 V
vs. Ag|AgCl(0.1M KCl).
3
The solid curve is the best fit of the equivalent cir-
cuit shown in the figure to the impedance spectrum, with
C
lar
=92 nF,
R
lar
=0.126 G:,
C
s
=20 nF,
R
s
=0.155 M:,
C
m
=73 nF,
R
m
=2.2 M:,
C
:
=0.95
nF,
R
:
=170 :. Drop area= 2.2u10
-2
cm
2
.
Search WWH ::

Custom Search