Biomedical Engineering Reference
In-Depth Information
13 nA 0.5 nA
(C)
50
P
m
(a)
(b)
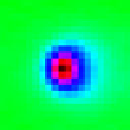
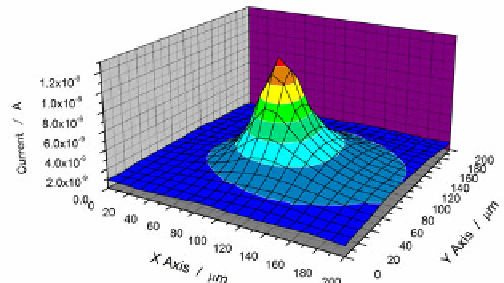
Figure 12. Continuation. (C) Representative SECM images (raw data) and their 3D expressions for the CP DNA/PQ/CF electrodes (
a
), and after
hybridization (
b
). All data were obtained at 19-μm s
-1
scan rate and +0.6 V for the Pt tip electrode, whereas the electrode potential of the sub-
strate was fixed at 0 V.


Search WWH ::

Custom Search