Biomedical Engineering Reference
In-Depth Information
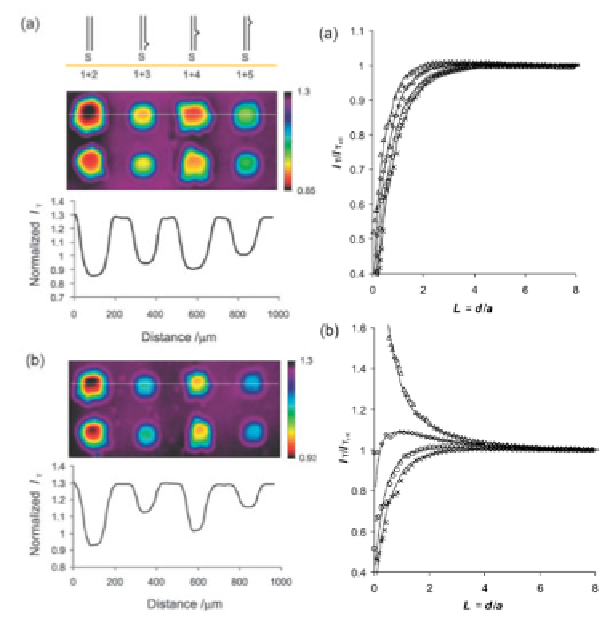
Figure 10. Left: Typical SECM image and current profile recorded over a ds-DNA
microarray on a Au substrate in the absence of Zn
2+
(a) Each spot follows the order,
1
+
2
,
1
+
3
,
1
+
4
, and
1
+
5
from left to right. Typical SECM image and current
profile recorded above DNA microarray in the presence of Zn
2+
(b) Data were
obtained for the same sample after incubation in Zn(ClO
4
)
2
solution. Experiment
carried out in 1 mM K
4
Fe(CN)
6
(50 mM NaClO
4
-20 mM Tris-ClO
4
, pH 8.6) using
25-μm Pt tip. During measurements, the electrode potential of the tip was kept at
+0.5 V (Ag/AgCl) for ferrocyanide oxidation. Right: Typical normalized approach
curves observed above individual ds-DNA spots for strands
1
+
2
(×),
1
+
3
(¸),
1
+
4
(o) and
1
+
5
(¨) measured in the absence (a) and presence (b) of Zn
2+
. Solid lines
represent simulated approach curves. All pictures taken from Ref. 41-Copyright
(2009) Reproduced by permission of the Royal Society of Chemistry.
Search WWH ::

Custom Search