Biomedical Engineering Reference
In-Depth Information
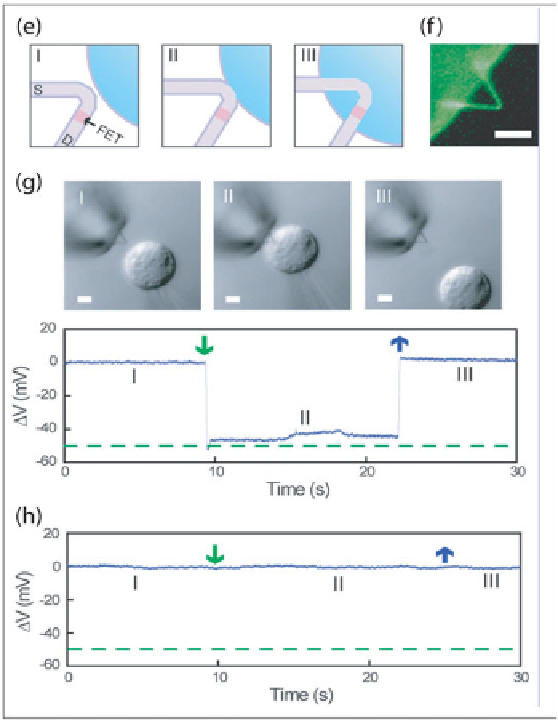
Figure 8. Continuation. (e) Schematics of nanowire probe entrance into a cell. Dark
purple, light purple, pink, and blue colors denote the phospholipid bilayers, heavily
doped nanowire segments, active sensor segment, and cytosol, respectively. (f)
False-color fluorescence image of a lipidcoated nanowire probe. (g) Differential
interference contrast microscopy images (upper panels) and electrical recording
(lower panel) of an HL-1 cell and 60° kinked nanowire probe as the cell approaches
(I), contacts and internalizes (II), and is retracted from (III) the nanoprobe. A
pulled-glass micropipette (inner tip diameter ~ 5 mm) was used to manipulate and
voltage clamp the HL-1 cell. The dashed green line corresponds to the micropipette
potential. Scale bars, 5 mm. (h) Electrical recording with a 60° kinked nanowire
probe without phospholipids surface modification. Green and blue arrows in (g) and
(h) mark the beginnings of cell penetration and withdrawal, respectively.
Search WWH ::

Custom Search