Biomedical Engineering Reference
In-Depth Information
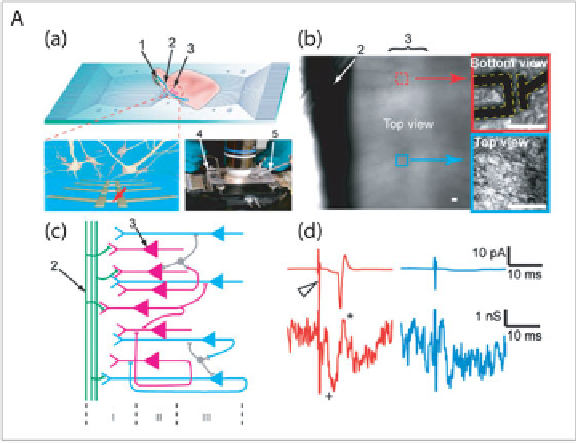
Figure 5. (A) NW-arrays for mapping neural circuits in the brain. (a) Measurement
schematics. (Top) Overview of a NWFET array fabricated on a transparent sub-
strate with slice oriented with pyramidal cell layer over the devices. (Bottom Left)
Zoom-in of device region illustrating interconnected neurons and NWFETs. (Bot-
tom Right) Photograph of the assembled sample chamber. 1, 2, and 3 indicate the
mitral cells in the olfactory bulb, the lateral olfactory tract, and the pyramidal cells,
resp. 4 and 5 mark the stimulation electrode and the patch clamp pipette, resp. (b)
Top view of the NWFET array/brain slice region in fully assembled chamber with
medium. Red Box shows a higher resolution image of a single device in contact
with the neurons at the bottom of the slice. Blue Box shows the outermost neurons
of the slice through an immersed lens from the top. (c) Laminar organization and
input circuitry of the piriform cortex (Layer I-III). (d) Conductance recording from
a NWFET (Lower Traces) in the same region as neuron used to record cell-attached
patch clamp results (Upper Traces). Stimulation in the LOT was performed with
strong (200 ȝA, Red Traces) and weak (50 ȝA, Blue Traces) 200 ȝs current pulses.
The open triangle marks the stimulation pulse. (B) Localized detection with
NWFET arrays. (a) (left) Optical image of brain slice over Si NWFET arrays de-
fined by electron beam lithography. The dashed frames mark the positions of de-
vices 1-4 and 5-6. (right) Schematics of the devices. (b) Signals obtained from
devices 1-6 with 200 μs stimulation of 2.5 (left) and 1 mA (right); n=21. The
dashed oval marks the region where signals of opposite polarity were recorded from
devices 30 μm apart.
Search WWH ::

Custom Search