Biomedical Engineering Reference
In-Depth Information
0.8
0.6
0.4
0.2
0.0
e
-0.2
-0.4
-0.6
(
a
* -
a
= 0.01 mm)
(
a
* -
a
= 0.03 mm)
(
a
* -
a
= 0.05 mm)
-0.8
-1.0
0
10
20
30
40
50
t
(10
6
second)
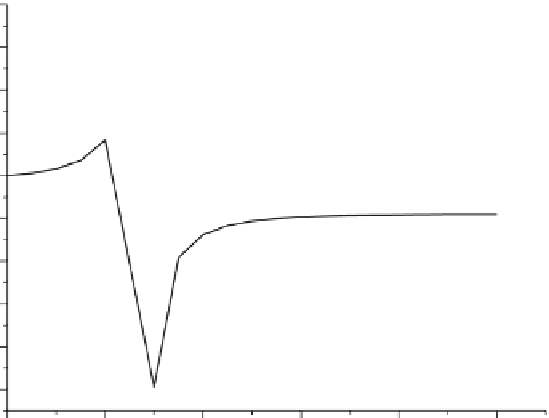
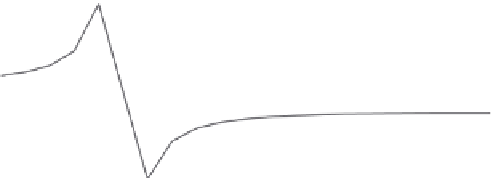
FIGURE 3.4
Variation of
e
with time induced by a solid pin.
maximum value of
e
) and osteopetrosis (excess porosity with the
minimum value of
e
), respectively.
• Figure 3.4 also shows the variation of
e
against tightness of fit.
It is evident that the tightness of it has significant effects on the
remodeling process, especially during the period when the abrupt
change of porosity occurs. It must be mentioned here that the
remodeling rate for this period can only serve as an indication of
the modeling process, since Equation (3.4) is only valid for predict-
ing a low remodeling rate. Thus, detailed analysis of the equation
will not provide any further reliable information. More sophis-
ticated and advanced remodeling models are evidently needed.
Nevertheless, the prediction does suggest that the possibility
exists of loss of grip on the pin or of high-level tensile stresses in
the bone layer surrounding the pin, which may induce cracks.
• Case 3: T
0
(
t
) = 10°C, 20°C, 30°C, 40°C,
• Figure 3.5 shows the effects of temperature change on bone
remodeling rate at
r
=
b
0
when φ
b
− φ
a
=
p
(
t
) =
P
(
t
) = 0. In general,
low temperature induces more porous bone structures, whereas
a warmer environment may improve the remodeling process
with a less porous bone structure. After considering all other
factors, it is expected that there is a preferred temperature under
which an ideal remodeling rate may be achieved.