Biomedical Engineering Reference
In-Depth Information
1.5
1.5
6-6'
3P
3-3'
3P
4P
1.0
1.0
4P
0.5
0.5
II
II
0.0
0.0
I
-0.5
-0.5
I
-1.0
-1.0
-1.5
-1.5
0
2000
4000
6000
8000 10000
0
2000
4000
6000
8000
10000
Time (ms)
Time (ms)
(a) Electrode 6-6´
(b) Electrode 3-3´
1.5
1.5
5-5'
3P
4P
2-2'
3P
4P
1.0
1.0
I
I
0.5
0.5
0.0
0.0
II
II
-0.5
-0.5
-1.0
-1.0
-1.5
-1.5
0
2000
4000
6000
8000
10000
0
2000
4000
6000
8000
10000
Time (ms)
Time (ms)
(c) Electrode 5-5´
(d) Electrode 2-2´
1.5
1.5
4-4'
3P
4P
1-1'
3P
4P
1.0
1.0
0.5
0.5
I
I
0.0
0.0
II
II
-0.5
-0.5
-1.0
-1.0
-1.5
-1.5
0
2000
4000
6000
8000
10000
0
2000
4000
6000
8000
10000
Time (ms)
Time (ms)
(e) Electrode 4-4´
(f) Electrode 1-1´
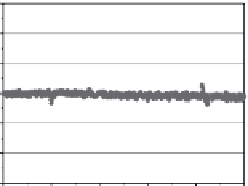
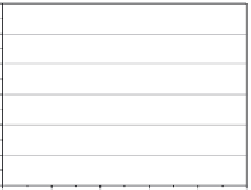
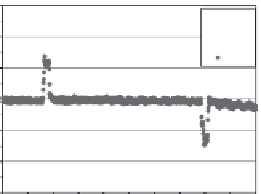
FIGURE 9.17
Typical plots of piezovoltage versus time for type A sample. (I: results for three-point test;
II: results for four-point test).
sample were lower than those obtained from the three-point bending test.
Moreover, the piezovoltages of the electrodes near the neutral axis in the
pure bending zone, such as 2-2′, 5-5′, and 8-8′, were approximately zero.
Nevertheless, the piezovoltage signs of electrodes 1-1′, 3-3′, 4-4′, and 6-6′,
which were little distant from the neutral axis, were random or irregular. In
contrast, the sign and peak of the piezovoltage of electrode 7-7′, which was
outside the pure bending zone, were similar to those under the three-point
bending test.