Biomedical Engineering Reference
In-Depth Information
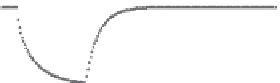
Again, in Figure 9.13(a)-(f) the curves I represent the fitting function (9.6)
with different
F
o
and
t
o
and the curves II are the corresponding measured
piezovoltages. Figure 9.13(a)-(c) shows three fitting curves with
F
o
= 150 N
and
t
o
= 250, 500, and 1000 ms, respectively; Figure 9.13(d)-(f) shows the
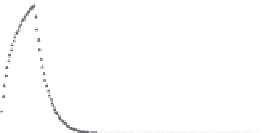
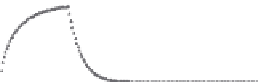
same three measured curves but corresponding to the unloading portion,
in which the red curves are obtained using the same fitting functions as
those in Figure 9.13(a)-(c). The coincidences of the curves in Figure 9.13(d)-(f)
imply that the piezovoltage curves during the unloading process have simi-
lar waveforms to those in the loading process.
Hou et al. [4] found that all the piezovoltage curves of the six samples had
the same form of fitting function. The first part (stretched exponential term)
1
1
0
0
0
500
1000
1500
2000
0
500
1000
1500
2000
-1
-1
II
II
I
-2
-2
I
-3
-3
-4
-4
Time (ms)
Time (ms)
(a) Measured voltage and fitted curve
at
F
o
= 150 N and
t
o
= 250 ms
(b) Measured voltage and fitted curve
at
F
o
= 150 N and
t
o
= 500 ms
4
1
3
0
0
500
II
1000
1500
2000
2
-1
I
1
-2
II
-3
0
0
500
1000
1500
2000
I
-4
-1
Time (ms)
Time (ms)
(c) Measured voltage and fitted curve
at
F
o
= 150 N and
t
o
= 1000 ms
(d) Measured voltage and fitted curve
at
F
o
= 150 N and
t
o
= 250 ms for unloading
4
4
3
3
2
2
I
1
1
II
II
0
0
0
500
1000
1500
2000
0
500
1000
1500
2000
I
-1
-1
Time (ms)
Time (ms)
(e) Measured voltage and fitted curve
at
F
o
= 150 N and
t
o
= 500 ms for unloading
(f) e voltage and fitted curve
at
F
o
= 150 N and
t
o
= 1000 ms for unloading
FIGURE 9.13
Fitting functions at different
F
o
and
t
o
for sample no. 2 (I: fitting results; II: measured results).