Biomedical Engineering Reference
In-Depth Information
(a)
(b)
(c)
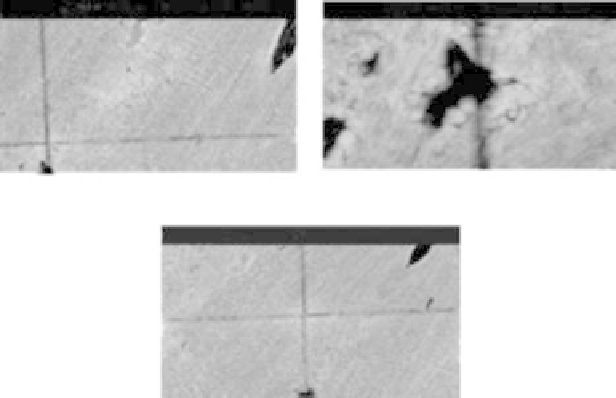
FIGURE 9.8
High-magnification BSE images of the indentation patterns at load 9.8 N, showing (a) a micro-
crack propagating from a large Haversian canal with a length of approximately 10 μm and
microcrack clusters developing from the boundaries of small osteocyte lacunae with lengths
less than 20 μm; (b) microcracks formed in the woven fibrils from a canaliculus, with lengths
less than 5 μm; and (c) a microcrack developing at the apex of indentation along the longitu-
dinal lamellae.
after indentation in the hardness tester. Each recovered hardness datum is a
single measurement with the SEM system error less than 2%; the initial hard-
ness datum is the average with one standard deviation of 18 indentations.
The hardness values calculated after recovery were found to be not only sig-
nificantly higher than the initial hardness mean value (ANOVA, p < 0.05)
but also significantly higher than the initial hardness mean value plus one
standard deviation (ANOVA, p < 0.05). In particular, at least 12% recovery of
the indentation deformation occurred at loads lower than 0.45 N, whereas at
least 5% recovery of the deformed bone occurred at loads higher than 1.96 N.
Figure 9.6(a) and 9.6(b) show that at load 9.8 N, the indented area covers sev-
eral osteons, woven fibrils, and interstitial lamellae [3]. To reveal deformation
details of the indentations, high-magnification BSE images are shown in
Figure 9.8. Figure 9.8(a) demonstrates a microcrack propagated from a large
Haversian canal with a length of approximately 10 μm. Yin et al. [3] also
indicated that microcrack clusters developed from the boundaries of small
osteocyte lacunae in the bone with lengths smaller than 20 μm. Figure 9.8(b)
shows microcracks formed in the woven fibrils from a canaliculus, with
lengths smaller than 5 μm. Figure 9.8(c) reveals a microcrack developing at
the apex of an indentation along the longitudinal lamellae.