Biomedical Engineering Reference
In-Depth Information
were selected for repeat tests and production of a total of 18 indentations at
each load. The indented samples were carbon coated and stored in an oven
at 42°C for 48 h so that they could be easily vacuumized in the SEM sample
chamber. Samples were observed under a SEM (Cambridge 360, Cambridge,
UK). Backscattered electron (BSE) imaging was performed at 20 kV accelerat-
ing voltage at a working distance of 16 mm, at 350× and higher magnifica-
tions. Both the optical microscope and the SEM were calibrated prior to the
length measurements and had relative system uncertainties of about 2%.
9.3.3 Testing Results
Yin et al. [3] reported their results obtained from the microindentation
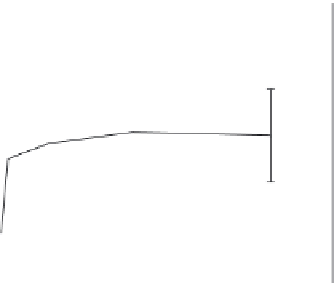
experiments they conducted in Figures 9.5-9.8. Figure 9.5 shows Vickers
hardness against applied load. Each datum is the average with one standard
deviation of 18 indentations in three samples. The figure demonstrates that
the hardness increased with the applied load. In particular, the hardness
significantly increased with the load at the low loads of 0.245 and 0.49 N
(ANOVA, p < 0.05). After the load reached 1.96 N, hardness was independent
of the load (ANOVA, p > 0.05). With an increase in the load from 0.245 to 4.9
N, hardness increased by 15% from a mean of 0.45 to 0.54 GPa, but hardness
values remained approximately unchanged when the load was increased
from 1.96 to 9.8 N.
Figure 9.6 shows a series of BSE images of indentation patterns at the
applied loads of 9.8, 4.9, and 1.96 N at 350× magnification. No cracks were
clearly observed in the indentation patterns for any applied load. Plastic defor-
mation was observed in all the indented areas. However, by measuring the
0.65
0.60
0.55
0.50
0.45
0.40
0
2
4
6
8
10
12
Indentation Force (N)
FIGURE 9.5
Vickers hardness of dry bone (lamb femurs). Each point is the average with the error bar of
±one standard deviation of 18 indentations in three samples.