Biomedical Engineering Reference
In-Depth Information
Experiment [12]
360*1
90*4
280
Experiment [12]
110
260
Present model
240
108
Present model
Experiment [12]
220
106
Experiment [12]
200
Present model
180
Present model
104
160
140
102
360*1
90*4
120
100
100
0 0
40
60
80 100
Time [days)
(a)
120
140
160
180
0
100
200
Time [days)
(b)
300
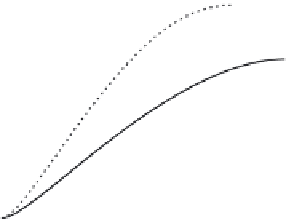
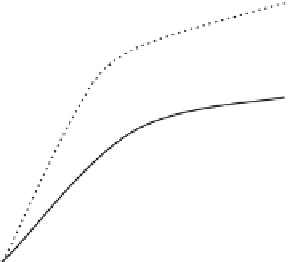
FIGURE 7.5
Simulation results and comparison with those from experiment in Robling et al. [12]. (a): BMC
(percentage) dynamics during extended loading period of 170 days. (b): Energy (percentage)
absorbed before bone fracture dynamics during the extended loading period of 365 days.
Note that in (a) and (b) the small squares and circles with the words “Experiment [12]” and
“Present model” represent the experimental and current simulation results, respectively, on
the 112th day.
Using the preceding model, in addition to BMC, which can be measured
easily through experiment, we can also gain insight into the cellular dynam-
ics of OBA, OCA, and OBP during the loading period, which is difficult or
perhaps impossible to measure in an experiment. Figure 7.4(a) shows the
population dynamics of OBA, OCA, and OBP during the 360 × 1 loading
period. It can be seen that OBA reacts quickly to the mechanical loading,
with a large increase rate because of the positive effect of PGE
2
in the first 30
days. It then keeps dropping slowly to the end of the experiment, which is
consistent with the decrease of PGE
2
in Figure 7.4(b). Due to the inhibitory
effect of NO on OCA through the RANK-RANKL-OPG pathway, the num-
ber of OCA drops slightly as a result of limited production and degradation.
Under the stimulatory effect of TGF-β (limited because of the limited activity
of OCA) and PGE
2
, the OBP numbers increase slightly compared with the
initial value and reach almost the same value as the OCA from the 60th day.
Figure 7.4(b) depicts the population dynamics of NO and PGE
2
in the
360 × 1 loading period. NO responds to the mechanical stimulus quickly
with a rapid increase in number, and PGE
2
is also found to increase, consis-
tent with the experimental results (see Section 7.2.2). The numbers of both
NO and PGE
2
start to decrease from the 30th day, probably because the bone
cells accommodate to the routine loading and become desensitized.
The dynamics of bone turnover (OBA + OCA) during the loading period
for the 360 × 1 and 90 × 4 loading schemes can be seen from Figure 7.4(c).
From the beginning to about the 30th day, both loading schemes cause bone