Biomedical Engineering Reference
In-Depth Information
0.06
0.05
0.04
0.03
0.02
0.01
0
0
20
40
60
80
100
120
t
/days
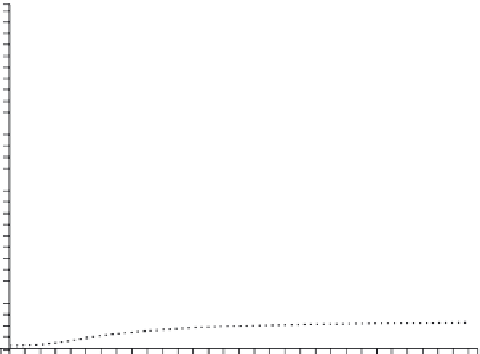
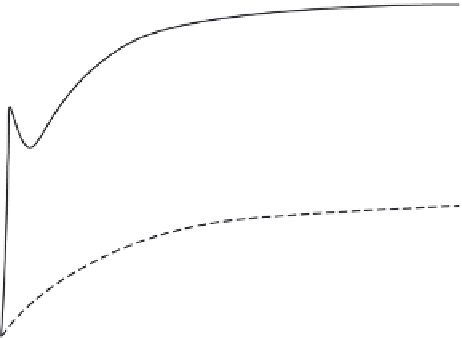
FIGURE 6.11
The responses of AOCs, AOBs, and ROBs to the continuous administration of PTH for 120 days.
of AOBs continues to increase even after the PTH administration ceases,
which is the key to the final increase in bone mass (see Figure 6.9). This is in
agreement with experimental observation [2].
As expected, under the continuous administration of PTH, bone mass
continually decreases, as shown in Figure 6.10. This simulation is in good
agreement with experimental results [2]. It can be observed from Figure 6.11
that the responses of AOCs, ROBs, and AOBs are affected by the PTH.
In particular, the number of AOCs increases promptly as PTH is injected,
followed by a minor drop, and then keeps rising at a slower rate. However,
the number of AOBs increases only slightly and at a very slow rate over the
first 120 days. Through the direct stimulatory effect of TGF-β released by
AOCs, the number of ROBs increases at a higher rate than that of the AOBs.
References
1. Pivonka P., Zimak J., Smith D. W., Gardiner B. S., Dunstan C. R., Sims N. A.,
Martin T. J., Mundy G. R. Theoretical investigation of the role of the RANK-
RANKL-OPG system in bone remodeling.
Journal of Theoretical Biology
262 (2): 306-316 (2010).
2. Wang Y. N., Qin Q. H., Kalyanasundaram S. A theoretical model for simulating
effect of parathyroid hormone on bone metabolism at cellular level.
Molecular
& Cellular Biomechanics
6 (2): 101-112 (2009).