Biomedical Engineering Reference
In-Depth Information
0.082
0.080
0.078
0.076
0.074
0.072
0.070
5 V
10 V
15 V
20 V
25 V
0.068
0.066
0.064
0.062
0
50
100
150
200
t
(day)
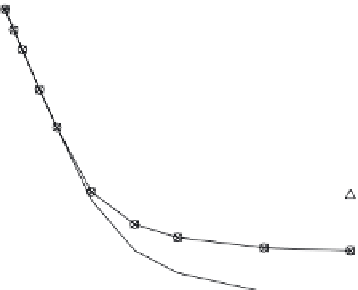
FIGURE 5.14
Variation of porosity
p
subjected to different electrical fields.
0.003
0.002
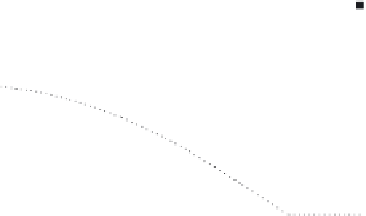
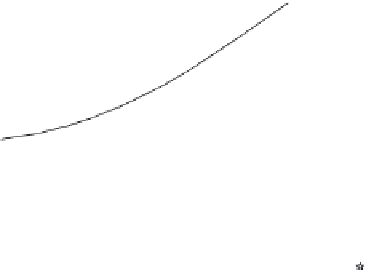
Dashed Line-ε
Solid Line-η
0.001
0.000
5 V
10 V
15 V
20 V
25 V
-0.001
-0.002
-0.003
0
10
20
30
40
50
60
t
(day)
FIGURE 5.15
Variations of ε and η subjected to different electrical fields.
Furthermore, gradual divergence of the internal remodeling rate,
differences in the trigger time, reversal of the change of the rate of sur-
face remodeling, and different cessation times can also be seen in this case
due to the inhomogeneous distribution of the environmental stimulus, as
in the case of transverse pressure. However, an electrical field seems to