Biomedical Engineering Reference
In-Depth Information
0.08
0.06
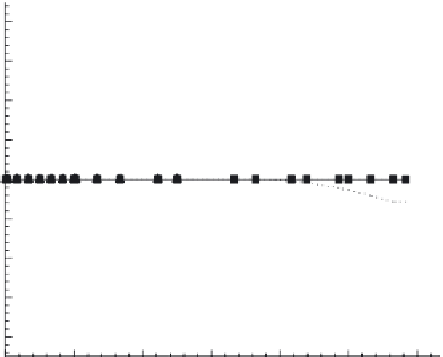
Dashed Line-ε
Solid Line-η
0.04
0.02
0.00
-0.02
P
= 1.6 kN
P
= 1.8 kN
P
= 2.0 kN
P
= 2.2 kN
P
= 2.4 kN
-0.04
-0.06
-0.08
0
300
600
900
1200
1500
1800
t
(day)
FIGURE 5.11
Variations of ε and η for several axial overloads.
are responsible for this. One is an insufficiency of osteoclasts. The capacity
of the body to produce osteoclasts restricts the upper limit of growth factors.
Therefore, the axial loading that can effectively stimulate bone remodeling
must have an upper limit.
The other factor is saturation of growth factors, which seems to contradict
the former factor. Nevertheless, as mentioned previously, when the poros-
ity of a bone is sufficiently reduced, the quantity of growth factors will
exceed the capacity of the bone to consume. The unconsumed growth factors
are then transported to the surface by fluid flows. At that time, an increase in
the environmental stimulus can accelerate surface bone remodeling only, not
internal remodeling. Thus, the internal remodeling rate also has an upper
threshold.
Figure 5.11 shows the influence of the axial pressure on surface bone
remodeling. The results indicate that the inner surface of the bone decreases
and the outer surface increases when the axial loadings exceed the MESm.
The effect of axial pressure on the inner and outer surfaces indicates that
axial pressure can increase the cross-sectional area of the bone and, conse-
quently, a thicker and stronger bone structure can be obtained, which can
decrease the strain on the bone structure. Furthermore, greater pressure can
result in more change in the surface of the bone and accelerate the recovery
of injured bone.
If we examine the two figures together, the results are interesting. In the
case of internal bone remodeling, when axial pressure increases, the poros-
ity initially increases and then becomes less as another equilibrium state is
finally achieved. The remodeling rate (the slope of the line) does not change