Biomedical Engineering Reference
In-Depth Information
0.044
0.042
0.040
0.038
0.036
0.034
E
i
= 1 V/m
E
i
= 10 V/m
E
i
= 50 V/m
E
i
= 100 V/m
0.032
0.030
0.028
0
100
200
300
400
500
t
(day)
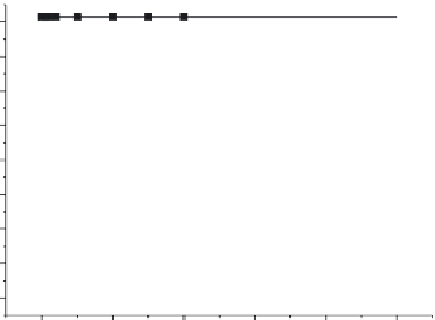
FIGURE 5.6
Variation of porosity
p
for several electrical changes.
0.044
0.042
0.040
0.038
0.036
B
i
= 0.2 mT
B
i
= 0.4 mT
B
i
= 1 mT
B
i
= 2 mT
0.034
0.032
0.030
0.028
0
100
200
300
400
500
t
(day)
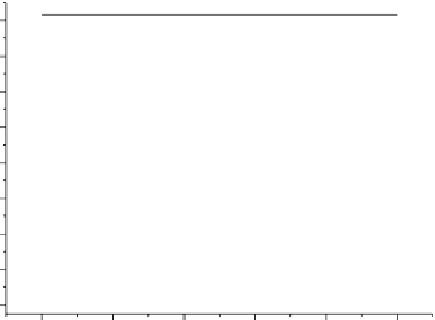
FIGURE 5.7
Variation of porosity
p
for several magnetic loadings.
On the other hand, the result also indicates that bone materials
become increasingly dense after electrical fields are loaded. Although
a remodeling balance may be finally reached, bone tissues exposed
to an electromagnetic field for a long time may incur a high risk of
bone hypertrophy.
• Case 4:
P
= 1.0 kN,
B
i
= 0.2, 0.4, 1, 2 mT,
f
e
= 15 Hz. Figure 5.7 shows the
effect of magnetic loading on the bone modeling process. The results
are similar to those for electrical loading. There are upper and lower