Biomedical Engineering Reference
In-Depth Information
DW
AW
MOW
POW
X
+
Remodeling
Lamellar drifts
Woven bone drifts
-
MES
γ
MES
m
MES
p
Fx
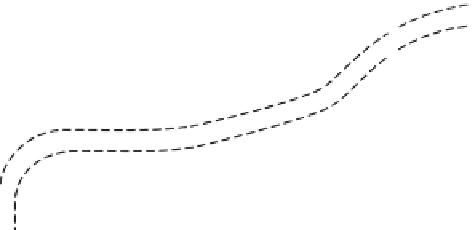
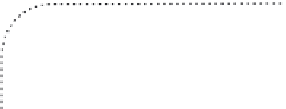
FIGURE 5.2
Combined modeling and remodeling effects on bone strength [37].
functions on and off. Figure 5.2 shows how these features would usually
affect bone strength.
The horizontal line at the bottom suggests typical peak bone strains from
zero on the left to the fracture strain on the right (
Fx
), plus the locations of the
remodeling, modeling, and microdamage thresholds (
MESr, MESm,
and
MESp,
respectively). The horizontal axis represents no net gains or losses
of bone strength. The lower dotted line curve suggests how disuse-mode
remodeling would remove the bone next to marrow when strains remain
below the
MESr
range; otherwise, the remodeling would tend to maintain
the existing bone and its strength. The upper dashed line curve suggests
how modeling drifts would begin to increase bone strength when strains
enter or exceed the
MESm
range. The dashed outlines suggest the combined
modeling and remodeling effects on bone strength. Beyond the
MESp
range,
woven bone formation usually replaces lamellar bone formation. At the top,
DW
= disuse window and
AW
= adapted window, as in normally adapted
young adults;
MOW
= mild overload window, as in healthy growing mam-
mals; and
POW
= pathologic overload window. The strain span between the
MESr
and
MESm
represents the span between those features in the general
biomechanical relations of bone.
It should be mentioned that the early work of Rubin and Lanyon [40]
demonstrated increased activation of remodeling on endocortical and
intracortical envelopes when strains were below a remodeling MES of 1,000


