Biomedical Engineering Reference
In-Depth Information
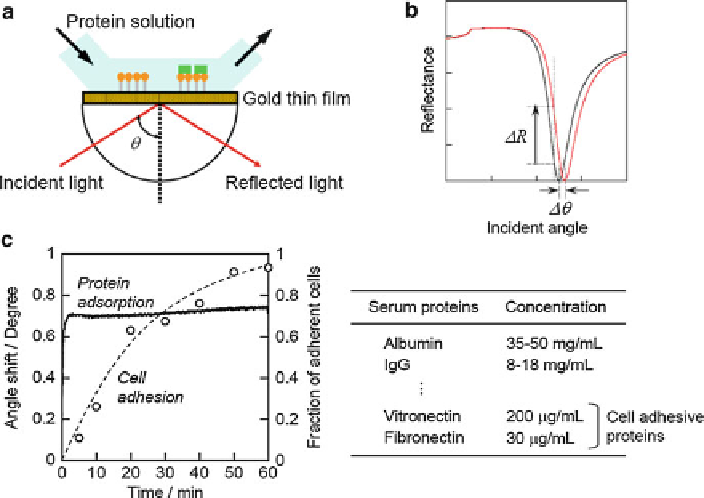
Fig. 4 The effect of proteins on cell adhesion. (a) Kretschmann configuration for SPR.
(b) Reflectance (
R
) as a function of incident angle (
), before (
black
) and after (
red
) the adsorption
of substances. (c)
Left
: Time course of SPR angle shift during exposure to culture medium
supplemented with 2% FBS (
solid line
) and the fraction of adherent cells determined by TIRFM
(
circles
)onNH
2
-SAM. The
dashed line
is a manual fit to the symbols, included simply as a guide
[
42
].
Right
: The concentrations of serum proteins in FBS
y
Figure
4c
shows one example of the time course of an SPR angle shift during
exposure of a NH
2
-SAM to culture medium supplemented with 2% fetal bovine
serum (FBS). It also includes the time course of the fraction of adherent cells on the
same surface determined by TIRFM observation (Fig.
2
). The SPR angle shift
rapidly increased, and then leveled off within a few minutes. Cells adhered much
more slowly than proteins. Those results indicated that serum proteins in a medium
rapidly adsorbed to the surface; then, cells interacted with the adsorbed protein
layer, as shown schematically in Fig.
5
.
Thus, cell adhesion is determined by nonspecifically adsorbed serum proteins on
the surface. Therefore, it is important to consider the characteristics of adsorbed
proteins including the amount, composition, and conformation or orientation.
2.3.1 Amount of Protein on a Surface
To suppress cell adhesion on a material surface, one approach is to inhibit the
adsorption of proteins. SAMs of alkanethiols that carry oligo(ethylene glycol)
(OEG) [
69
] and phosphorylcholine [
46
,
70
,
71
] have been shown to prevent