Biomedical Engineering Reference
In-Depth Information
XP
A
B
θ
C
a
b
1
Figure 4.4
Beam on an elastic foundation for theoretical analysis of deflection. Load
P
is applied
at the location,
θ
is the slope of the beam at the point of application of the load
cos
(λa)
sin
h (λb))
+
sin
(λl)(
sin
h (λa)
cos
(λb)
−
cos
h (λa)
sin
(λb))
]
)
(4.2)
where
P
= applied force,
λ
=
4
√
K/
4
EI
,
K=
ω
K
0
,
K
0
= foundation modulus in N
mm
-3
,and
ω
= width of the silicon in contact with the PVDF/Plexiglas substrate.
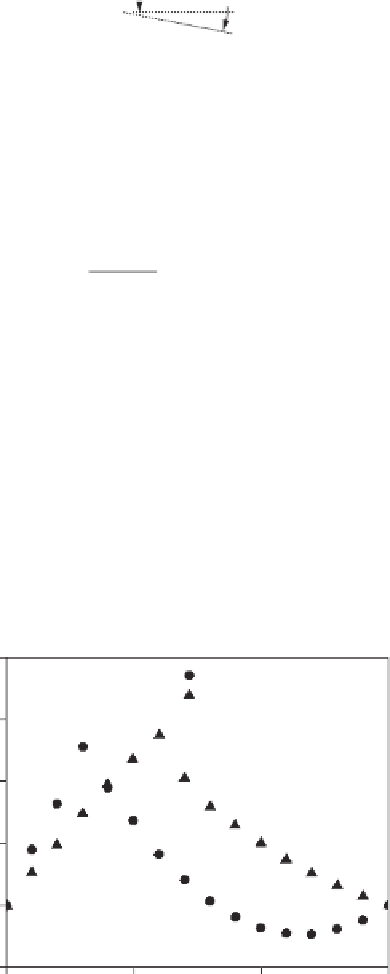
Figure 4.5 shows the distribution of shear force
Q
along the length of the sensor
structure (i.e., total length of the sensor,
l=
15 mm) for a concentrated load applied at
locations
x
= 3 and 6 mm away from the edge of the silicon (i.e., tooth numbers 1, called
Touch 1 and tooth No 2 called Touch 2 in Figure 4.2). The analytical results confirm the
intuitive observation that, as the distance from the concentrated load increases, the shear
force decreases.
The slope angle
θ
, which defines the angle between the tangent to the deflected curve
at the load point and reference axis, is given in [12]:
+
sin
h (λx)
sin
(λx) .
[sinh
(λl)(
sin
(λa)
cos
h (λb)
−
cosh
2
(λa)
cos
2
(λb)
−
cos
2
(λa)
cosh
2
(λb)
sinh
2
(λl)
−
2
Pλ
2
K
θ
=
(4.3)
sin
2
(λl)
0.8
For load applied on Touch 1
For load applied on Touch 2
0.6
0.4
0.2
0.0
-0.2
0
5
10
15
Distance along the sensor (mm)
Figure 4.5
Theoretically derived stress distribution along the sensor length for a point load