Biomedical Engineering Reference
In-Depth Information
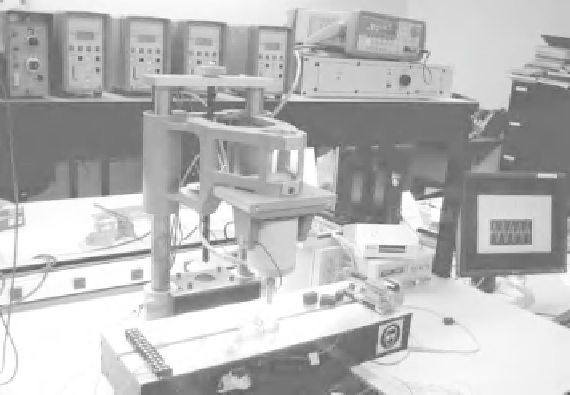
Signal Generator
Power
Amplifier
DAQ
Connection
Box
Charge Amplifiers
Signal
Shaker
Reference
Load Cell
Adjustable
Table
Sensor
Under Test
Figure 3.23
A view of experimental setup used to measure the PVDF response to the friction
materials
built-in Butterworth low-pass-filter, the 60 Hz line noise was eliminated and the peak-
to-peak output, together with the corresponding input, was recorded. This data was then
saved in a file and plotted against the theoretical results, as shown in Figure 3.24 in which
the theoretical curve is the result of an FE model for the uniaxial PVDF film executed
foranappliedloadof22kPa.
Figure 3.24 also shows experimental data that reveals a decaying trend when the friction
coefficient is increased. However, for friction coefficients greater than 0.5, the projections
of the abrasive papers would have caused permanent and local scratches leading to an
increase in output. Therefore, for
μ>
0.6, no consistent data was obtained.
0.4
0.3
0.2
0.1
0
0
0.2 0.4
Friction coefficient
0.6
Figure 3.24
Comparison between theoretical data and experimental results. For both cases a 20 N
force is applied (error bar indicates the range of readings)